Photo courtesy of Matt Marton-USA TODAY Sports
The Cubs’ bullpen is, incontrovertibly, not very good this year. Joe Maddon, usually cagey to a fault about criticizing his team in public, recently labeled the ‘pen’s inability to perform the team’s “Number One Problem” (capital letters added for emphasis). The numbers back him up. Here’s the bullpen’s performance on some top-line pitching statistics this season*, with major-league ranks in parentheses:
| IP | ERA | DRA | cFIP |
| 120.0 (20th) | 4.20 (22nd) | 4.42 (27th) | 98 (22nd) |
Obviously, the Cubs would rather not be in the bottom third in any category this particular season, given that they have aspirations of contention, but they would especially prefer not to rank in the bottom third in bullpen performance, which tends to play up in importance in the postseason. Even more than most, this is a problem they would like to fix, and fix soon. It’s an especially vexing problem, moreover, because going into the season it was seen as an area of some strength, mostly in light of a pretty solid 2014 performance by the ‘pen:
| IP | ERA | DRA | cFIP |
| 536.1 (2nd) | 3.61 (15th) | 3.71 (10th) | 97 (18th) |
I’ll dig deeper into those numbers later, but for now it’s enough to note that, in 2014, the Cubs had a perfectly serviceable bullpen—better, certainly, than their 2013 (4.77 DRA, 27th; 103 cFIP, 27th) and 2012 (4.89, 30th; 107, 30th) versions—but, this year, it’s regressed by nearly 20 percent in terms of both ERA and DRA. The interesting question, as always, is why that might be the case.
This piece poses, in turn, six hypotheses which might explain the Cubs’ poor ‘pen performance this season, and presents the evidence—insofar as such evidence exists—for each’s contribution to the poor performance we’ve observed. The method is, clearly, only quasi-scientific, and the correct answer probably falls in the interaction between all six factors or, perhaps, in a seventh factor not considered here. For this piece in particular, I’m looking forward to hearing from you, on Twitter or in the comments, with your reactions and suggestions.
Hypothesis #1: Cubs’ relievers have been particularly unlucky this season.
Random variations in performance are a fact of life in baseball, and it’s possible that the Cubs’ relief corps has simply run into a spate of bad luck this season. If this is the case, we’d expect to see (among other things) an increase in the number of balls in play that turn into hits due to poor fielding or just plain old bad luck—in short, an increased BABIP allowed by Cubs’ relievers. So far this year, that hasn’t been the case. In 2014, Cubs’relievers allowed a .297 BABIP and, this year, that number is up only marginally, to .305. Given that the relievers have given up virtually identical percentages of hard-hit balls (27.2 percent in 2014 versus 27.9 percent this year), and that their percentage of batters left on base—70.6 percent—is virtually indistinguishable from last year’s 70.8 percent, we can safely say that luck is, at best, a minor factor in the ‘pen’s poor performance this season.
Hypothesis #2: Cubs’ relievers have been particularly tired this season.
Rest, I am reliably informed, is a good thing for human beings to have. This is true of members of the public, like myself, and it is also true of major-league pitchers. It is possible that part of the relievers’ poor performance this season might come down to them being tired, and therefore less able to execute pitches. Looking at the data, it’s possible there’s something here. Two particular stats stand out. This season, 24.3 percent of the Cubs’ relief appearances have come when that pitcher had zero days rest—i.e., when he pitched the day before. In 2014, that number was 19.4 percent, meaning that Cubs’ relievers have seen a 25 percent increase in the number of times they’ve been asked to jump on the mound with no rest.
Secondly, the relievers the Cubs have used this season, they’ve used a lot; moreover, they’re the same relievers the Cubs used a lot last season. To wit: In 2014, 61.0 percent of the Cubs’ relief innings pitched were thrown by their top five relievers (namely, Carlos Villanueva, Justin Grimm, Hector Rondon, Pedro Strop, and Brian Schlitter). This season, a full 66.1 percent of the Cubs’ relief innings pitched have gone to their top five guys—an eight percent increase—and two of those guys (Rondon and Strop) are the same ones who were relied upon last year. Two others who saw heavy usage in 2014 (Grimm and Schlitter) have either been injured or ineffective for most of this season, and Carlos Villanueva is now a Cardinal.
In short, I think there’s something here. Cubs’ relievers’ usage—already fairly concentrated in just a few hands last season—has become even more concentrated this season; in addition, those same relievers have seen a marked increase in the number of times they’re asked to pitch on zero days rest.
Hypothesis #3: Cubs’ relievers just aren’t locating their pitches.
For what it’s worth, this is Maddon’s explanation (or part of it). In the ESPN Chicago piece linked above, Maddon lamented the ‘pen’s inability to make a big pitch when they needed it. Well, let’s look at the data. Here’s a chart that shows the percentage change in the number of pitches thrown in a given strike zone location by Cubs relievers, with positive numbers being increases from 2014 and negative numbers being decreases. The zone is from the perspective of the catcher, so pitches in the top left corner are inside to right-handed hitters and outside to lefties.
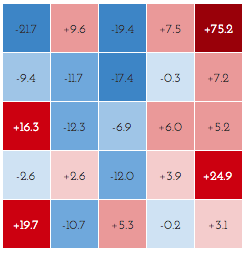
There’s a lot to digest here, but two things stand out to me. First, the Cubs relievers actually seem to be doing pretty well at putting the ball outside the hittable zone (the center nine boxes). The only increases in that zone are down, which is where you’d want them, or inside to lefties—also typically a good thing. The big increases are all on the outside of the plate, especially inside to lefties and away to righties.
And it doesn’t appear that this new set of locations is leading to more walks: the Cubs’ relievers’ 9.4 percent walk rate this year is only marginally increased from last year’s 8.9 percent. The strikeout percentage—22.5 percent last year and 22.2 percent this year—is virtually unchanged. So what, if anything, might be driving poorer results if the Cubs’ relievers have actually become better at keeping the ball away from hitters without giving up many more walks?
Well, it could be that pitchers are getting crushed when they do throw in the zone. This year, Cubs’ relievers have thrown 43 percent more sliders, as a percentage of their total pitches, than they did last year. Besides the cutter—which has seen an incredible 164 percent increase in usage—this is the largest increase of any pitch. It seems possible to me that Cubs’ relievers are getting hit hard when they mess up their slider location (which might be interacting with the tiredness described above) but at this point that’s only conjecture. It could also be that …
Hypothesis #4: Cubs’ relievers are getting screwed by the umps.
Perhaps the Cubs’ relievers simply aren’t getting the calls they need from the umps, and even though it’s not showing up in their walk rate—described above—it’s forcing them back into the zone, where their pitches are getting hit. But the data simply doesn’t back it up. This season, the Cubs’ have moved from dead last in relief Called Strikes Above Average (CSAA) to actually somewhat above average, and fourth in the National League. This positive development can probably be attributed to the arrival of Miguel Montero and David Ross, both noted pitch framers, but does little to explain the Cubs’ poor bullpen performance. Perhaps, then …
Hypothesis #5: Cubs’ relievers have the yips.
This is more a note than anything else, as I haven’t seen anything written about it besides a stray comment from Miguel Montero about Hector Rondon getting worked up when runners get on base: Cubs’ relievers have entered the game with a leverage index, on average, of 1.42, indicating a situation with very high potential to swing the outcome one way or another. Not only is that the highest average inLI (leverage upon entering the game) in the majors, it’s significantly higher than last year’s mark of 0.87, which was 24th. This is partly a product of being a better team—the Cubs are “in” the game more often—but it also means Cubs’ relievers have to combat their nerves more often that they did last year. Perhaps they have the yips.
Hypothesis #6: Nothing underlying has changed, just results.
I promised that I’d come back to the numbers laid out in the introduction, and now I have. Take a look back at the Cubs’ relievers’ cFIP numbers for 2014 and 2015: they’re virtually identical, at 97 and 98. Because cFIP, unlike DRA, is intended to be both predictive and descriptive, the interpretation of those numbers in concert with the radically divergent DRAs is that nothing in particular has changed about the Cubs’ relievers’ performance, except their performance. Maybe it’s luck, showing up in a way I didn’t describe here. Maybe it’s the tiredness, or the pitch mix, which seemed the most likely candidates of those I identified. Or maybe it’s something totally different. Baseball is a weird game, and there are a thousand ways to interpret any given observation. Something is driving the change in results, but maybe the only thing we can do is wait and hope the relievers regress to their true talent level, as expressed by cFIP.
As promised, this exercise was only quasi-scientific, but it has yielded—I hope—some interesting points for further discussion and exploration. As noted in the introduction, the Cubs are going to need their bullpen to turn things around sooner rather than later, despite their positive team record so far. Insofar as what I’ve written here has any meaning, I might propose giving relievers a bit more rest than they’ve been getting so far, and making sure not to leave too many sliders hanging in the zone. Groundbreaking insights, these are not. But they might be worth a try.
Rob McQuown of Baseball Prospectus made significant contributions to the research of this piece; any mistakes that slipped in are mine.
Thank you for your thoughts, Rian. Out of curiosity I checked the sliders of Rondon, Rosscup and Strop this season, but I’m not sure what we are looking for to see, if slider’s been a problem. Number of hits given up off of the sliders? Number of sliders thrown in the middle of the zone?
As of now, I prefer to stick to the “lesser claim”, which is your 6th hypothesis. We should wait and see.
I think there’s two ways you can look at it. One is, as you say, to look at the number of sliders (or other pitches that saw increases) thrown in the middle of the zone, and look at the outcomes of those pitches. Brooks Baseball has some good resources for this, and I might well do a followup piece on that. The other way is to invert that last, and look at the pitches which have been hit the hardest this year, I’d imagine either by ISO or by Hard%.
The puzzle that I can’t work out is that there’s clearly more damage being done – that shows up in the DRA – but I’m not sure where it’s happening. Both approaches mentioned above would get you closer to that answer, but neither (I think) all the way there. For now, you’re absolutely right that the “lesser claim” is an appropriate default. Thanks for your feedback, it’s really appreciated!