Much was made about Jon Lester’s lack of throws to first after his Opening Night start against the Cardinals, which is easy to understand. It was the first game of the season, featuring a national broadcast with a three-man booth using every bit of information generated by their producers. After the game, I didn’t hear all that much about it—except for Ben Lindbergh’s piece in Grantland. And Michael Salfino’s bit in the Wall Street Journal. Oh, and my fellow writer at Beyond the Box Score, Randy Holt and this post. And also on a daily basis when listening to 670 The Score. Other than that, not much.
Over a year or so ago, I wrote a piece looking at throws to first. I wrote it for several reasons—it was still two months before the opening of the 2014 baseball season and I was starving for ideas, I had the data, and I was really curious to see if my editors would let me write about anything I wanted (the answer—yes). I thought it was among the dumbest things I ever had or would write (there’s stiff competition for that title, believe me) because I thought it took one element of the game and magnified its significance without putting it in greater context. I had every expectation of following up that post with an examination of stolen base patterns by pitchers but never got around to it. With all the chatter about Lester’s lack of throws to first, it’s time to revisit that data and put it in context.
I was unable to watch Monday’s game against the Reds and thus see Lester’s “historic” throw to first, but saw the video at mlb.com—not pretty. If this were to become Lester’s new standard, I would highly recommend not throwing to first ever again, but I’ll return to this topic later. For now, this table shows the number of throws to first by pitchers since 2009, with plenty of explanation to follow:
| Pitcher | From | To | IP | To1 | TT1 | SB | CS | PO |
|---|---|---|---|---|---|---|---|---|
| Felix Hernandez | 2009 | 2014 | 1394.1 | 1267 | 492 | 120 | 38 | 6 |
| Justin Verlander | 2009 | 2014 | 1378 | 1242 | 1069 | 93 | 40 | 11 |
| James Shields | 2009 | 2014 | 1355.2 | 1261 | 486 | 46 | 22 | 25 |
| Clayton Kershaw * | 2009 | 2014 | 1270.2 | 1045 | 606 | 46 | 44 | 46 |
| Cole Hamels * | 2009 | 2014 | 1258.1 | 1083 | 410 | 118 | 53 | 21 |
| Jon Lester * | 2009 | 2014 | 1241.1 | 1213 | 244 | 96 | 37 | 15 |
| Mark Buehrle * | 2009 | 2014 | 1237.0 | 1222 | 675 | 23 | 28 | 39 |
| Dan Haren | 2009 | 2014 | 1235.0 | 1019 | 307 | 93 | 28 | 4 |
| Jered Weaver | 2009 | 2014 | 1227.1 | 1023 | 384 | 103 | 31 | 17 |
| Jeremy Guthrie | 2009 | 2014 | 1213.1 | 1224 | 450 | 44 | 21 | 10 |
| Zack Greinke | 2009 | 2014 | 1213.1 | 1083 | 413 | 43 | 39 | 11 |
| David Price * | 2009 | 2014 | 1207.1 | 1074 | 493 | 75 | 42 | 14 |
| Tim Lincecum | 2009 | 2014 | 1194.0 | 1199 | 513 | 138 | 32 | 3 |
| Cliff Lee * | 2009 | 2014 | 1191.2 | 974 | 149 | 33 | 17 | 6 |
| A.J. Burnett | 2009 | 2014 | 1191.0 | 1312 | 694 | 177 | 37 | 20 |
| Max Scherzer | 2009 | 2014 | 1183.1 | 1096 | 516 | 81 | 55 | 7 |
| Ervin Santana | 2009 | 2014 | 1176.0 | 1149 | 438 | 115 | 34 | 3 |
| CC Sabathia * | 2009 | 2014 | 1162.0 | 1105 | 226 | 56 | 22 | 9 |
| Matt Cain | 2009 | 2014 | 1156.2 | 977 | 433 | 91 | 42 | 4 |
| Yovani Gallardo | 2009 | 2014 | 1155.0 | 1182 | 487 | 77 | 22 | 8 |
| Hiroki Kuroda | 2009 | 2014 | 1135.2 | 989 | 484 | 60 | 28 | 7 |
| Adam Wainwright | 2009 | 2014 | 1130.2 | 1001 | 238 | 31 | 18 | 2 |
| Edwin Jackson | 2009 | 2014 | 1128.2 | 1172 | 582 | 103 | 28 | 9 |
| Bronson Arroyo | 2009 | 2014 | 1125.0 | 1017 | 401 | 42 | 26 | 3 |
| R.A. Dickey | 2009 | 2014 | 1121.1 | 1060 | 432 | 36 | 15 | 14 |
* = left-handed pitcher
This data is adapted from play-by-play data at Baseball-Reference and is sorted by total innings pitched since 2009. Using Felix Hernandez as an example, he’s pitched almost 1,400 innings since 2009 and had 1,267 opportunities with runners on first (To1, or Times on 1st, essentially singles + walks + HBP) and made 492 throws to first (TT1). Runners stole 120 bases on him, were thrown out 38 times and picked off 6 times, but I didn’t clean this up enough to show only steals of second. Since the vast majority of stolen base attempts are to second, this data serves our purposes. Let’s break down Lester further and see his throws to first by year:
| Year | TT1 | SB | CS | PO |
|---|---|---|---|---|
| 2009 | 74 | 19 | 6 | 6 |
| 2010 | 94 | 22 | 7 | 5 |
| 2011 | 66 | 14 | 12 | 4 |
| 2012 | 5 | 13 | 3 | 0 |
| 2013 | 5 | 12 | 4 | 0 |
| 2014 | 0 | 16 | 5 | 0 |
It’s a pretty stark line of demarcation—he used to be very comfortable throwing over to first, but seemed to stop doing so in 2012, and not in a gradual way, but the rare radical switch in philosophy driven by whatever motivation there was. However, players attempted to steal 21 times in 2014 versus 29 times in 2010 when he was still throwing over to first. Having written that, the stolen base attempts in 2014 did increase markedly from 2012 and 2013, but a percentage increase doesn’t necessarily translate into a noticeable effect—that increase in steal attempts is around one every five to six starts.
As a left-hander, Lester has an advantage in that he can stare down runners, and the numbers bear this out not just for him but for all left-handed pitchers. Mark Buehrle’s ability in managing the opponent’s running game is well-known, and in general, the pitchers with the highest stolen base totals are right-handers. It can’t all be laid on the pitcher’s shoulders, of course, since many things have to go well for second to be stolen—speed by the base stealer, a good jump, an inaccurate throw by the catcher, and a poor tag by the fielder. However, if a pitcher isn’t keeping runners honest and allows them to gain an extra step, often it’s that one step that can make the difference between success and failure.
Throws to first matter only if they’re coupled with an inability to keep opponents from stealing, and on first blush, this doesn’t appear to be the case with Lester—the stolen base attempts didn’t really change all that much regardless of whether he was throwing to first or not, which is not what one would expect if this was a huge issue. In this group of pitchers, he’s in the middle of the pack in terms of stolen base attempts, well behind A.J. Burnett despite pitching in fifty more innings, so there are pitchers worse at controlling the running game. However, among left-handed pitchers, he’s behind only Cole Hamels in stolen base attempts, and many of the other lefties have far fewer stolen base attempts.
I had a brief Twitter discussion with fellow BP Wrigleyville contributor Brett Taylor last week:
@FullCountTommy @ScottLindholm @MattSpiegel670 I’m waiting for a runner to just take off while Lester is staring at him. See what happens.
— Brett Taylor (@BleacherNation) April 9, 2015
I was waiting for this as well, since I fully suspected Billy Hamilton would be the first person to try this out. This depends on Hamilton reaching first in the first place, which has been an issue in his short career, but at least so far this year, he seems to have added the ability to take a walk to his game. Alas, no Hamilton in the Monday night game due to a sore left index finger, so we’ll have to wait for another day to see what happens, but there will be plenty of other burners waiting to test Lester—Jean Segura, Carlos Gomez, and Starling Marte come immediately to mind. On a brief side note, if Billy Hamilton can gain the discipline to take 100 walks a year, he’ll be one of the most dangerous players in the game.
Here’s something not widely known, especially as baseball nears the tenth year in a row of declining offense. The natural inclination is to think that when runs are harder to score, strategies to manufacture runs like base stealing and sacrifice bunts increase as teams attempt to generate offense. This chart shows the number of stolen base attempts (SB + CS) and sacrifice bunts per game since 1980:
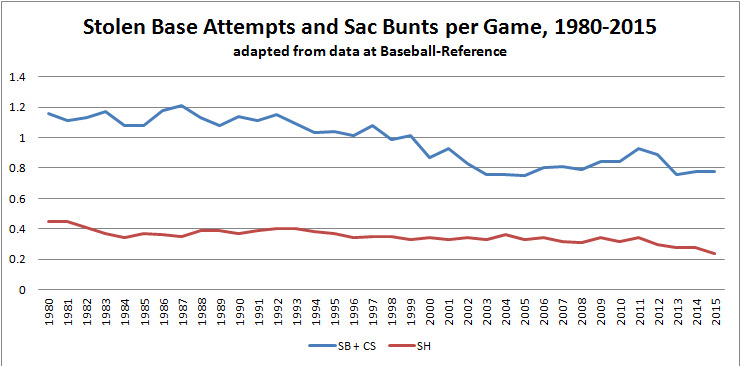
As the realization that the advantage of an extra base is often outweighed by the cost of an additional out, teams are far more judicious in taking risks. This doesn’t mean stealing and sacrificing runners over have disappeared from the game, but it’s much more common to take the game context and hitter into consideration. If teams are showing a greater reluctance to steal, holding runners on becomes far less important than in the past.
But that doesn’t mean it’s never important—Lester’s throw last night came when the score was tied in the second inning and could have had far worse consequences later in the game or if Jorge Soler hadn’t backed up the play and prevented further damage. The game may come where Lester throws to first and lets one get away that allows the game-winning run to score. And with expanded playoff slots creating the greater chance that only one game will separate teams from October baseball and October golf, it’s entirely possible that a bad throw by Lester could be the difference in the outcome of the Cubs’ season, but that’s quite a bit of hyperbole. I’d be far more concerned if Lester was having difficulty getting his pitches over the plate, but a brief look at his Brooks Baseball zone profile doesn’t suggest a pitcher who’s losing his command.
There have been nine pickoffs in all of baseball through Monday so far in 2015—eight by pitchers and one by a catcher. In addition, there have been nine botched pickoff attempts, which includes Lester’s. Of the 807 throws to first by pitchers so far this year, that’s about one percent of the time that a bad throw to first led to an error. Lester is working at a 50 percent rate right now, so the odds suggest this will decrease.
As I continue to write for BP Wrigleyville, my usual method will be to look at data to see if stories hold up to closer scrutiny. Sometimes they will, sometimes they won’t, and often it will be somewhere between these extremes. Lester and his throws to first appears to be one of those mixed cases—players aren’t running rampant on him and scoring runs in droves because he isn’t holding runners on base, but there has been a change in his approach in holding base runners on. It’s just not so obvious that it matters all that much.
You know that Lester threw over to first twice on that runner, right?
Sullivan took a good look at it last year: http://www.fangraphs.com/blogs/instagraphs/jon-lester-pickoff-throws-but/. Apparently it’s been an issue since at least the ’12 season but hasn’t caused much damage for the reasons you note. I guess if one is to develop a Blassian mental block this is one of the more benign flavors.