Photo courtesy of Jake Roth-USA TODAY Sports
I was doing research for a piece on the difference in strikeout rates depending on whether there were runners in scoring position or if the bases were empty, and I was struck by a number that leaped off the page at me. In addition to the Cubs bucking the trend of teams having lower strikeout rates with runners in scoring position, they were near the stratosphere in terms of strikeouts as well. This should not surprise me, since BP Wrigleyville editor Sahadev Sharma suggested a team might break strikeout records this season in a Baseball Prospectus article last January—in this case it was the Astros, but the same could be applied to this year’s North Siders as well.
Through Tuesday, the Cubs had 377 strikeouts in 38 games, a pace for over 1,600 by season’s end if it’s maintained. These are the teams with the most strikeouts in a season:
| Team | Year | Record | TB | BB | KO |
|---|---|---|---|---|---|
| Houston | 2013 | 51-111 | 2049 | 426 | 1,535 |
| Arizona | 2010 | 65-97 | 2275 | 589 | 1,529 |
| Chicago Cubs | 2014 | 73-89 | 2118 | 442 | 1,477 |
| Houston | 2014 | 70-92 | 2084 | 495 | 1,442 |
| Minnesota | 2013 | 66-96 | 2114 | 533 | 1,430 |
| Miami | 2014 | 77-85 | 2091 | 501 | 1,419 |
| Milwaukee | 2001 | 68-94 | 2338 | 488 | 1,399 |
| Oakland | 2012 | 94-68 | 2231 | 550 | 1,387 |
| Atlanta | 2013 | 96-66 | 2186 | 542 | 1,384 |
| NY Mets | 2013 | 74-88 | 2035 | 512 | 1,384 |
TB=total bases
I informed Sahadev and the rest of the BP Wrigleyville crew that I’d be writing about this, which caused fellow contributor Rian Watt to ask if this was a franchise or MLB record. When I informed him it would be the most strikeouts in baseball history, he responded, “Wow. What a time it is to be alive. First 20th Century team doesn’t even crack the top 50.” The entire list can be viewed here, and indeed, the 1996 Tigers are the first team from prior to 2000 to make the list, with 1,268 strikeouts—almost 350 fewer than the Cubs are poised to reach.
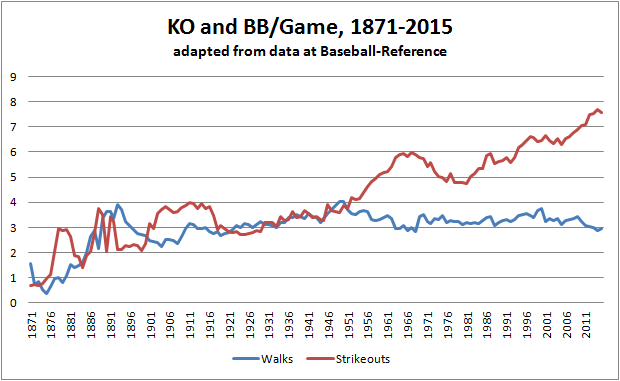
I would argue any day above ground is a wonderful time to be alive, but Rian’s observation that the top 50 teams are from the past 15 years really got my attention. It’s no real secret that strikeouts are increasing, the real question is why. It’s a mix of a willingness to swing coupled with teams stocking up on power arms in relief roles that can overpower hitters late in the game. Other factors, like newer, smaller parks that entice players to swing for the fences, also play a role. This chart shows the change in walks and strikeouts per game throughout baseball history:
| Team | Pit | Swg Str | % Pit | O-Swing | O-Swing% |
|---|---|---|---|---|---|
| Houston | 5665 | 649 | 11.5% | 376 | 6.6% |
| Chicago Cubs | 5901 | 673 | 11.4% | 421 | 7.1% |
| Baltimore | 4938 | 552 | 11.2% | 367 | 7.4% |
| Colorado | 5046 | 553 | 11.0% | 340 | 6.7% |
| Milwaukee | 5378 | 570 | 10.6% | 375 | 7.0% |
| Minnesota | 5528 | 585 | 10.6% | 365 | 6.6% |
| San Diego | 5824 | 615 | 10.6% | 411 | 7.1% |
| Pittsburgh | 5635 | 588 | 10.4% | 390 | 6.9% |
| Seattle | 5431 | 552 | 10.2% | 333 | 6.1% |
| Miami | 5653 | 568 | 10.0% | 377 | 6.7% |
| Tampa Bay | 5793 | 581 | 10.0% | 346 | 6.0% |
| LA Dodgers | 5614 | 558 | 9.9% | 360 | 6.4% |
| Cincinnati | 5482 | 538 | 9.8% | 341 | 6.2% |
| Detroit | 5911 | 578 | 9.8% | 375 | 6.3% |
| Washington | 5812 | 566 | 9.7% | 386 | 6.6% |
| Toronto | 5913 | 574 | 9.7% | 355 | 6.0% |
| Chicago White Sox | 4927 | 476 | 9.7% | 305 | 6.2% |
| St. Louis | 5630 | 541 | 9.6% | 350 | 6.2% |
| Arizona | 5447 | 520 | 9.5% | 357 | 6.6% |
| San Francisco | 5640 | 520 | 9.2% | 341 | 6.0% |
| Texas | 5769 | 526 | 9.1% | 350 | 6.1% |
| NY Mets | 5564 | 497 | 8.9% | 314 | 5.6% |
| Kansas City | 5384 | 472 | 8.8% | 327 | 6.1% |
| NY Yankees | 6113 | 533 | 8.7% | 361 | 5.9% |
| LA Angels | 5246 | 454 | 8.7% | 299 | 5.7% |
| Philadelphia | 5419 | 468 | 8.6% | 322 | 5.9% |
| Atlanta | 5280 | 411 | 7.8% | 272 | 5.2% |
| Cleveland | 5704 | 440 | 7.7% | 281 | 4.9% |
| Boston | 6047 | 465 | 7.7% | 310 | 5.1% |
| Oakland | 6187 | 451 | 7.3% | 296 | 4.8% |
Of the 5,901 pitches the Cubs have seen through Tuesday, 673 (11.4 percent) were swinging strikes. Of those pitches, 421 were outside the strike zone (O-Swing), and when a team shows a willingness to swing freely at bad pitches, the chances they’ll get good pitches to hit decreases significantly.
Then again, look at the teams at the bottom of the chart—none of the bottom five are having any real success this year. It’s not an absolute that more strikeouts leads to less success, and perhaps the 2015 Cubs are that special team that can overcome and defy the odds. So far, they’ve been able to do so, but it leaves little margin for when things don’t go absolutely right.