
Here at Baseball Prospectus, we hold ourselves—and the work that we produce—to a high analytical standard. Claims made without appropriate warrant or evidence are unacceptable on our sites, and we expect our writers to construct arguments which flow neatly from logical premises to sound and replicable conclusions. It’s the way we’ve done business here since 1996, and it’s in that spirit that I present to you the following chart, which represents my Highly Scientific view of how the National League will shake out in 2016:
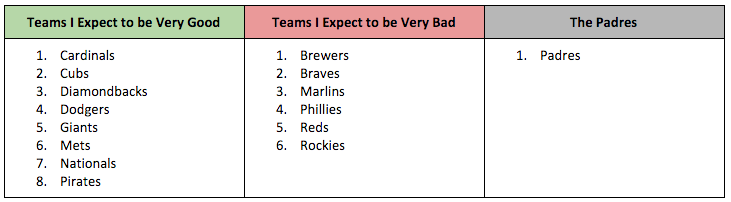
The thing I hope you notice about this list—besides the fact that it represents a personal Flight of Fancy—is that the Padres are all alone in the final column. That’s because, in my view, the Padres are the only 2016 National League team which has limited potential for both greatness and disaster. They will be, in all likelihood, just sort of ok. The rest of the National League, however, is fairly easily split into two camps: teams that will likely be very, very good, and teams that will likely be very, very bad.
That’s my expectation. But, of course, the league isn’t going to finish with eight teams at 98 wins, six at 73 wins, and the Padres right at .500. Teams are going to spread out over the course of the season, and a combination of over-performance and under-performance (relative to expectations) will result in a final finish that’s quite a bit less black and white than the chart I showed you above. And yet, every now and then, I see folks talking about how the National League in 2016 is going to be the most unequal it’s ever been.
That didn’t feel right to me, so I decided to dig into it, and set expectations for what extreme stratification has actually looked like in baseball’s recent past, and thus the outer limit of what we might expect in 2016. This piece is the result. To be clear: this isn’t some massive, bold piece of baseball research, like the #Catchella stuff we debuted at the main site yesterday. It’s just some gentle expectation-setting going into 2016.
So, if you’d like something to talk about at your next cocktail party, or have a few minutes to kill, or are tied to a chair in in front of your computer screen, please do carry on. We’re in this together now. Here we go.
—
There are probably a lot of ways to find the most stratified seasons in recent National League history, but let’s try a simple one (if you think of a good technique I haven’t used here, let me know in the comments). For each league-season since 1966, let’s pull the following information:
- The mean number of wins achieved by the league’s teams;
- The standard deviation of the mean number of wins;
- The minima and maxima;
- The 25th percentile win total, and;
- The 75th percentile win total.
For each year, let’s then subtract the 25th percentile value from the 75th percentile value to come up with a win “spread”—essentially, a number that represents the difference, in any given year, between the good (but not the best) teams and the bad (but not the worst) teams.
Why is this useful? Well, because years in which teams are clustered at the extremes should also be years in which the 25th percentile value is especially low, and the 75th percentile value is especially high. In those same years, the spread value we’re calculating should be larger than in years where teams are clustered near the center of the standings, or distributed evenly. That spread value, in turn, will allow us to (roughly) rank seasons by the degree to which the National League was either stratified or evenly distributed.
It’s not a particularly sophisticated technique, of course, but then we’re not trying to be particularly sophisticated. We’re just interested in getting a general sense of how bad inequality has gotten in the past, and this technique is unlikely to return an answer that’s obviously ridiculous. As someone who is often obviously ridiculous on a personal level, that’s a good enough standard for me.
So here (drum roll, please) are the most stratified National League seasons of the last 50 years, as measured by inter-quartile spread:
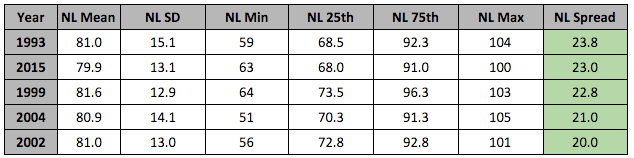
It’s interesting, in its own way, that 2015 is near the top of the list—after all, the teams that will compete in 2016 are necessarily similar to those which competed in 2015—but (like Donald Trump) we’re not here to talk about second place finishers. Let’s talk about 1993.
We can now say, with some limited degree of confidence, that that season was the most stratified National League season in the last 50 years, and that it’s the season that 2016 will have to beat if it’s to become the new standard for baseball inequality.
So what did the standings actually look like in 1993? Once we’ve seen those standings, we’ll have a better sense of what extreme inequality looks like in the standings, and the degree of stratification we might reasonably expect to see once the curtain comes down on the 2016 regular season.
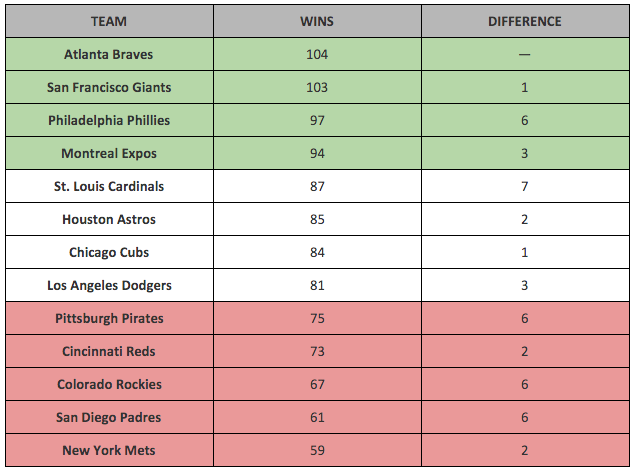
That’s … sort of underwhelming. Yeah, there are kind of three tiers here, if you squint (I’ve helped the process along by using pretty colors). But it’s not like there’s an obvious divide between good teams and bad. So no, 2016 won’t see the league evenly-divided between the super-teams and the super-terrible. If you knew that before you read this, congratulations, and I’m sorry for your lost time. If you didn’t, you now have something to talk about when folks talk about the “rise of superteams” on Twitter, or at that cocktail party you’re going to.*
*Do people go to cocktail parties any more? Do they talk about baseball there?
Thanks are due to BP’s Rob McQuown for his research help on this piece.
Lead photo courtesy Jerry Lai—USA Today Sports.
Nice work…interesting.
So I wonder what this means for the 2015 iteration of the NL Central? Given that 2015 came in as the second-most stratified in league history, and given that the Central Division had the top three teams (in all of baseball, no less) in the NL, I wonder if this means that 1) the triumvirate of teams in the NL Central may have been one of the best ever, and 2) The disparity between the top three and bottom two had to be the largest ever….?
With respect to your second point, I’m not sure. With respect to your first, I think it’s quite likely — certainly within a divisional group. It’ll be something worth looking into at the end of 2016, too.
psst.. Marlins, 64 wins
Ah, good catch! Totally slipped my mind, but happily doesn’t change the analysis at all. Thank you.
One thing to remember is the very bad teams do in fact play one another, in the case of Marlins Phillies and Braves, they play each other a lot. So if the Marlins are the “best” of the “very bad” teams they could end up with a decent record at the end of the season, even if they really have no chance against the “very good” teams.
Very good point, and one that helps explain the mechanism that translates a two-tiered preseason into a three-tiered league table at the end of the season.
Very good piece overall.
Hey, thanks!