
The month of April finished with Joe Maddon deviating from the standard rotation for the first time, coming as a result of inclement weather and a preference for starting Kyle Hendricks against the Nationals instead of the Pirates. Cubs’ pitchers faced unusually tough weather for the end of April, with cold temperatures and strong winds creating uncomfortable conditions for taking the mound. The starters didn’t seem fazed, as the results were outstanding as usual. The group of four combined to throw 25 innings, while allowing just six earned runs. The team followed suit, going 3-1 and securing their fifth consecutive winning turn through the rotation.
The decision to skip Hendricks was an interesting one, and I don’t fully agree with Maddon’s reasoning and explanation. My preference would have been to maintain the previously scheduled rotation to maintain continuity, with the added benefit of giving each of the other four starters an extra day of rest, rather than giving Hendricks an extra three days off. However, this is without question an area that Maddon’s closeness to the situation holds more water than anything else, and armchair analysis simply cannot grasp the human elements behind the decision.
Jake Arrieta (April 28th, vs. Milwaukee Brewers)
Result: 5 IP, W, 1 ER, 3 H, 6 K, 4 BB, 92 pitches
Season: 5-0, 1.00 ERA, 3.20 K/BB, 2.85 FIP
Velocity/Usage/Movement:
| Pitch Type | Count | Freq | Velo (mph) | pfx HMov (in.) | pfx VMov (in.) | H. Rel (ft.) | V. Rel (ft.) |
|---|---|---|---|---|---|---|---|
| Fourseam | 1 | 1.09% | 92.34 | -2.73 | -11.64 | -3.09 | 6.67 |
| Sinker | 66 | 71.74% | 94.57 | -7.89 | -15.42 | -3.16 | 6.55 |
| Change | 3 | 3.26% | 90.00 | -10.09 | -23.15 | -3.40 | 6.41 |
| Slider | 18 | 19.57% | 89.89 | 3.95 | -26.35 | -3.28 | 6.43 |
| Curve | 4 | 4.35% | 80.83 | 6.70 | -54.08 | -3.12 | 6.52 |
Location:
Observations:
Jake Arrieta failed—if you can call it that—in his bid for a 25th consecutive start, as Maddon pulled him after five uneven innings. I’ve been critical of Maddon’s usage of starting pitchers this season, believing he was straying from the strategy of limiting starters innings in the early going to save them for October. This decision marked a step away from that, as it would have been easy to let Arrieta stay out there for one more inning to continue his pursuit of Bob Gibson’s record of 26 consecutive quality starts. It was a responsible decision that kept the bigger goal in mind, as Arrieta’s streak has already established records and statistical anecdotes aplenty.
The shakiness exhibited by the Cubs ace was a predictable outcome, as he was coming off of by far his longest outing of the season, throwing 119 pitches in his memorable no-hitter against Cincinnati. It isn’t fair to directly correlate the lengthy outing with the results of this start, but the combination of the added fatigue, weather and Arrieta’s relative wildness in his previous start aligned to create the scenario that prevented him from continuing his quality start streak.
It was the shortest outing for Arrieta since May 2nd of last season, a five-inning outing that was also against Milwaukee. The main culprit for the early hook was a relative lack of command, as he walked four batters in just five innings. He threw just 57 strikes—a season low by seven strikes—but did manage to limit hard contact and generate 40 SNIPs. While his no-hitter also featured a relative lack of command, this outing’s heatmap showed an even greater lack of control, as he concentrated a glut of pitches in the middle of the zone:
April 28th start April 21st start
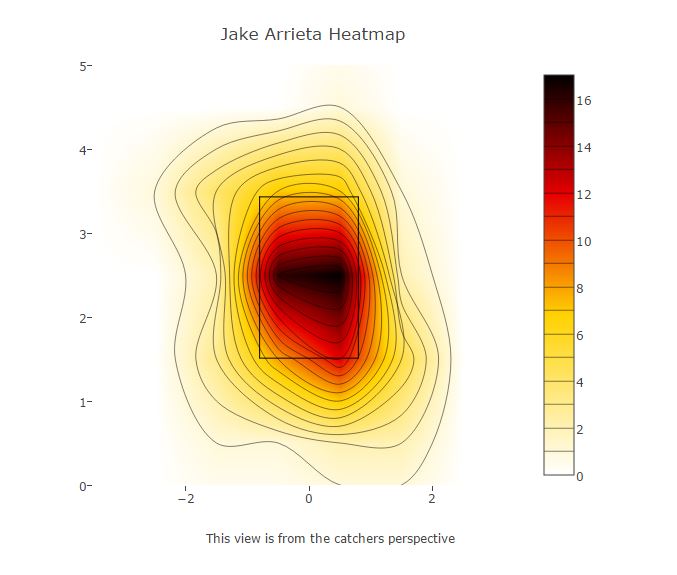
Arrieta’s pitch-selection may be the strongest clue he knew his stuff would be a notch lower, as his nearly 72 percent rate of sinker usage was by far his highest of the season. His sinker suffered a dip in velocity, and he was unable to hold his velocity as his pitch count elevated:
Both his sinker and slider also suffered from significantly reduced vertical break, another side effect of the cold weather and lesser stuff. Arrieta’s results continue to be fantastic, but this outing is an example that yes, he is still a human being.
Jon Lester (April 29th, vs. Atlanta Braves)
Result: 7 IP, ND, 1 ER, 7 H, 10 K, 2 BB, 106 pitches
Season: 2-1, 1.83 ERA, 4.71 K/BB, 3.26 FIP
Velocity/Usage/Movement:
| Pitch Type | Count | Freq | Velo (mph) | pfx HMov (in.) | pfx VMov (in.) | H. Rel (ft.) | V. Rel (ft.) |
|---|---|---|---|---|---|---|---|
| Fourseam | 52 | 49.06% | 93.30 | 6.46 | -11.89 | 2.90 | 5.77 |
| Sinker | 9 | 8.49% | 92.16 | 10.06 | -20.94 | 2.91 | 5.74 |
| Change | 3 | 2.83% | 86.98 | 8.37 | -22.73 | 2.93 | 5.77 |
| Curve | 11 | 10.38% | 76.37 | -6.23 | -47.74 | 2.87 | 5.82 |
| Cutter | 31 | 29.25% | 89.06 | -0.08 | -21.10 | 2.89 | 5.79 |
Location:
Observations:
Jon Lester continues to allow Theo Epstein to sleep a little easier with every start, as thus far he has been worth every penny of his massive contract. Seven innings of one run ball allowed Lester to collect his fifth straight quality start. He struck out 10—tied for a season high—while throwing 106 pitches, also a season high. Lester’s command markedly improved in his last start from his previous start, while this start backed up just a bit:
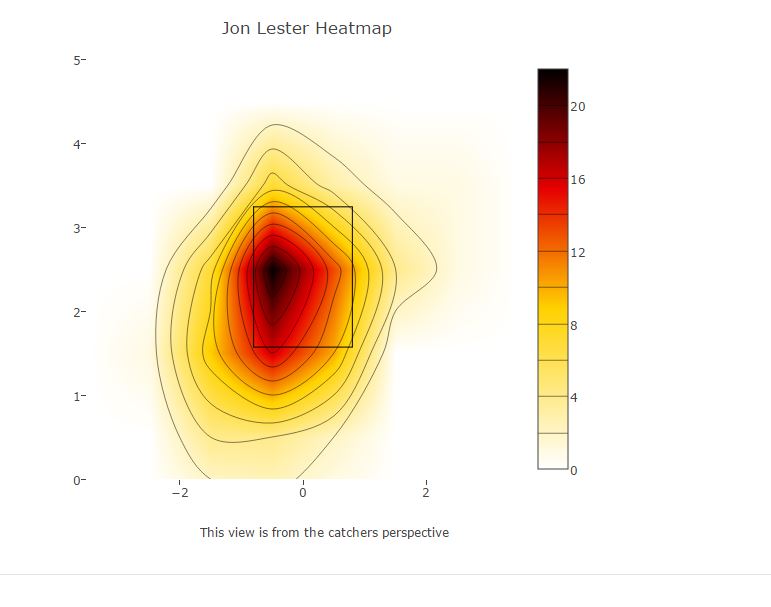
When Lester is at his very best, you’ll see the darkest concentrated areas located around the inside corner to a right-handed batter. He achieved this in his last start, but left his average pitch thigh-high and around four inches higher this start, while maintaining excellent horizontal location. Look for Lester to attempt to lower the number offerings that end up in the middle section of the zone.
We’ve been monitoring Lester’s velocity after he seemed to suffer diminishes velocity early on. It’s encouraging to see him sustain the gains he made in his last start:
| Game | Fourseam | Sinker | Change | Curve | Cutter |
|---|---|---|---|---|---|
| CHN@ANA (4/5/16) | 92.65 | 92.09 | 85.87 | 76.43 | 88.79 |
| CIN@CHN (4/11/16) | 91.40 | 90.65 | 85.24 | 75.54 | 88.33 |
| COL@CHN (4/17/16) | 92.50 | 91.27 | 85.06 | 75.18 | 89.12 |
| CHN@CIN (4/22/16) | 93.63 | 92.58 | 87.16 | 76.45 | 90.00 |
| ATL@CHN (4/29/16) | 93.30 | 92.16 | 86.98 | 76.37 | 89.06 |
Lester probably had his best stuff of the season in this outing, generating 15 whiffs and a season-high 55 SNIPs. His horizontal release point shifted significantly towards his arm-side, with which he generated more lateral break than normal. This change did not come at the expense of his vertical release point, which indicates Lester shifted his starting point on the rubber towards the first base side. The result of this is similar to what batters face against Arrieta, with the pitch coming into the zone from a greater diagonal angle than most pitchers. It’ll be interesting to follow whether or not this is a permanent change for Lester—perhaps taking a cue from Arrieta—or simply a one-game alteration because of a specific scouting profile.
John Lackey (May 1st, vs. Atlanta Braves)
Result: 8 IP, L, 3 ER, 3 H, 2 K, 3 BB, 99 pitches
Season: 3-2, 4.32 ERA, 3.22 K/BB, 3.31 FIP
Velocity/Usage/Movement:
| Pitch Type | Count | Freq | Velo (mph) | pfx HMov (in.) | pfx VMov (in.) | H. Rel (ft.) | V. Rel (ft.) |
|---|---|---|---|---|---|---|---|
| Fourseam | 39 | 41.05% | 91.76 | -3.45 | -16.64 | -2.63 | 6.30 |
| Sinker | 12 | 12.63% | 91.66 | -9.15 | -25.30 | -2.67 | 5.79 |
| Change | 7 | 7.37% | 84.76 | -9.37 | -27.57 | -2.39 | 6.36 |
| Slider | 21 | 22.11% | 82.73 | 4.32 | -37.47 | -2.29 | 6.44 |
| Curve | 16 | 16.84% | 78.63 | 4.87 | -48.13 | -2.39 | 6.54 |
Location:
Observations:
Lackey’s longest start of the year was also his most peculiar, as he was efficient without having pinpoint command. He allowed three walks—generally a recipe for disaster for Lackey—but maintained relative success by allowing just three hits. This would make you think he kept the ball down in the zone, but that also wasn’t the case, as he threw 29 pitches into the middle of the zone profile. His heatmap suggests he should have been hit hard, but the woeful Braves offense could only muster the aforementioned three knocks:
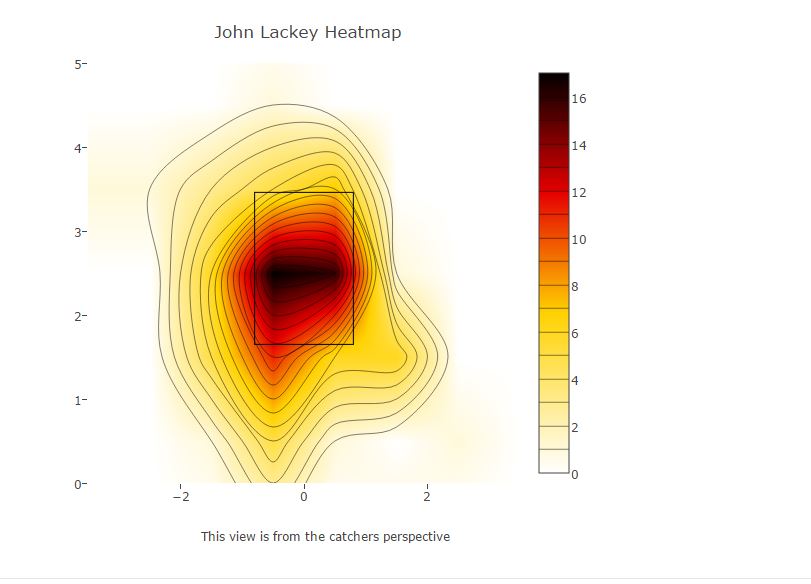
I was vocal before the game in stating that I believed Maddon should only allow Lackey five innings, as the sixth inning had been a relative disaster for him this year as he suffered from waning velocity. The sixth inning was again a struggle, as a leadoff single followed by a walk led to two Atlanta runs. To his credit, he threw well enough to make it through eight innings despite the tumultuous sixth frame. His velocity was markedly down all game, but he did show an improvement in maintaining consistency into the later innings. It’s worth considering whether Lackey realized he may have been overthrowing early in games, which led to an inability to sustain velocity through the middle innings:
Seperately, Lackey has been slowly increasing his offspeed usage, with his curveball the greatest benefactor this week:
| Game | Fourseam | Sinker | Change | Slider | Curve |
|---|---|---|---|---|---|
| CHN@ARI (4/7/16) | 19 | 29 | 6 | 27 | 2 |
| CIN@CHN (4/13/16) | 44 | 16 | 0 | 24 | 4 |
| CHN@SLN (4/18/16) | 33 | 16 | 9 | 19 | 14 |
| CHN@CIN (4/23/16) | 40 | 22 | 9 | 16 | 8 |
| ATL@CHN (5/1/16) | 39 | 12 | 7 | 21 | 16 |
| WAS@CHN (5/6/16) | 42 | 28 | 6 | 17 | 18 |
It’s hard to argue with the approach, as he’s been far more effective with his offspeed offering this season than he has with his fastballs. Check out his slugging-against per pitch:
| Year | Fourseam | Sinker | Change | Slider | Curve |
|---|---|---|---|---|---|
| 2016 | 0.657 | 0.688 | 0.222 | 0.146 | 0.263 |
Jason Hammel (May 2nd, vs. Pittsburgh Pirates)
Result: 5 IP, W, 2 ER, 5 H, 3 K, 1 BB, 89 pitches
Season: 4-0, 1.24 ERA, 2.50 K/BB, 3.04 FIP
Velocity/Usage/Movement:
| Pitch Type | Count | Freq | Velo (mph) | pfx HMov (in.) | pfx VMov (in.) | H. Rel (ft.) | V. Rel (ft.) |
|---|---|---|---|---|---|---|---|
| Fourseam | 15 | 16.85% | 93.89 | -4.12 | -13.68 | -1.82 | 6.58 |
| Sinker | 31 | 34.83% | 93.71 | -8.37 | -19.03 | -1.92 | 6.49 |
| Change | 2 | 2.25% | 85.67 | -7.18 | -26.65 | -2.01 | 6.35 |
| Slider | 38 | 42.70% | 85.37 | 3.47 | -36.00 | -1.92 | 6.63 |
| Curve | 3 | 3.37% | 77.19 | 8.19 | -51.94 | -2.01 | 6.52 |
Location:
Observations:
This was the least efficient and least effective outing of the season for Jason Hammel, which is impressive considering he allowed just two earned runs and collected his fourth win. Hammel has done an excellent job limiting hard contact and hits this season, as the five hits allowed this start represent a season-high. His preference would be to achieve limiting hits while increasing efficiency, as his 54-35 strike-to-ball ratio leaves a bit to be desired.
Hammel appears to be straying from his highly effective early-season usage of the upper-inner portion of the zone, instead relying heavily on the lower and outer portions of the zone. This is a bit disheartening, as I believe his success is aided by effectively throwing high and inside. One of the effects of ignoring this portion of the zone is not generating many popups, and sure enough Hammel has failed to force even one over his last two starts, after generating seven in his first three starts combined. If he’s striking out a significant amount of batters he can get away with it, but in starts such as this where he whiffs just three hitters, a lack of popups means there are too many balls-in-play for my liking.
It’s encouraging to see Hammel sustain the trend of higher velocity, but I am concerned about his continually rising reliance on his slider:
| Game | Fourseam | Sinker | Change | Slider | Curve |
|---|---|---|---|---|---|
| CHN@ARI (4/8/16) | 34 | 6 | 6 | 31 | 12 |
| CIN@CHN (4/14/16) | 39 | 16 | 0 | 21 | 12 |
| CHN@SLN (4/19/16) | 17 | 31 | 4 | 14 | 18 |
| CHN@CIN (4/24/16) | 24 | 26 | 0 | 39 | 7 |
| CHN@PIT (5/2/16) | 15 | 31 | 2 | 38 | 3 |
| WAS@CHN (5/7/16) | 28 | 10 | 3 | 34 | 22 |
This trend goes hand-in-glove with his zone profile, as his slider is almost always directed towards the lower outside corner, while his fastballs can be located effectively in other areas. It’s becoming rather predictable for hitters, and I’d like to see him reduce his slider usage to around the 30 percent mark. This would allow him to diversify his offerings and keep hitters off-balance more effectively. If it sounds like I am being overly-critical of a 4-0 pitcher allowing just over one earned run per game, it’s because I am. However, we’ve seen brilliant early-season results from Hammel in the past, only to see him falter later in the season. Making these small adjustments now could help him sustain his success deeper into the season.
Lead photo courtesy David Kohl—USA Today Sports.
What is/are SNIPs? I check the BP glossary and couldn’t find a definition. I’ve probably heard it before but forgot what it is.
Hi, ‘Strikes Not In Play’