The sixth turn through the rotation featured an unconventional order (at least with respect to the early season), but the same standard of excellence. Just when it seemed the results couldn’t improve, Cubs starters enjoyed their first perfect turn, leading the team to a perfect 5-0 record, while allowing just five earned runs over 30 2/3 innings. The tone was set by the first three starters, with Jake Arrieta, Jon Lester and Kyle Hendricks combining to throw 18 2/3 innings of scoreless ball.
It’s been a historic start for Cubs starters, as every starter has gone at least five innings in each outing, the longest stretch in team history since 1910. The offense received most of the attention over the offseason, but it’s truly the starting pitching staff that has achieved the greatest heights early in the season.
Jake Arrieta (May 3rd, vs. Pittsburgh Pirates)
Result: 7 IP, W, 0 ER, 2 H, 5 K, 2 BB, 99 pitches
Season: 6-0, .84 ERA, 3.08 K/BB, 2.85 FIP, 3.82 DRA
Velocity/Usage/Movement:
| Pitch Type | Count | Freq | Velo (mph) | pfx HMov (in.) | pfx VMov (in.) | H. Rel (ft.) | V. Rel (ft.) |
|---|---|---|---|---|---|---|---|
| Fourseam | 6 | 6.06% | 93.78 | -1.74 | -13.08 | -2.92 | 6.82 |
| Sinker | 45 | 45.45% | 93.89 | -6.78 | -16.28 | -2.98 | 6.75 |
| Change | 4 | 4.04% | 89.51 | -9.18 | -26.72 | -3.31 | 6.61 |
| Slider | 30 | 30.30% | 87.53 | 4.31 | -31.70 | -3.10 | 6.67 |
| Curve | 14 | 14.14% | 79.77 | 6.11 | -52.97 | -2.95 | 6.78 |
Location:
Observations:
Arrieta appeared to make an effort to get back to pitching to contact in this start, as his pitch plot was much tighter than in his last few efforts:
In his no-hitter, he threw 23 pitches more than six inches outside of the zone, which led to four walks. In this start, he threw just 10 pitches more than six inches outside, instead staying in or near the zone with much greater frequency. His arm slot was noticeably higher than in his last two starts, and stayed more towards the center of the diamond. This led to decreased horizontal movement, but improved the vertical bite on his pitches. It may seem a bit counter-intuitive for Arrieta to correct his delivery to be more upright—as he reinvented himself partly by throwing across his body—but this appeared to be a necessary change, as he had been coming open a bit too far in previous starts. His heavily weighted, third base side release point is undoubtedly part of his success, but there is a point where it can become too much of a good thing, leading to an inability to maintain his pinpoint command. He only generated 10 whiffs with this approach, but he only allowed two hits as the contact against him was soft. Combining just two hits with two walks is an excellent recipe for success, especially for a guy like Arrieta who almost never gives up home runs.
Arrieta struggled to maintain his velocity into the later innings, suffering around a 3-mph drop in his fastball in the later innings. This is his second consecutive outing there has been a dramatic drop off, so I’d like to see some shorter outings in the future to take a bit of strain off:
This coincides with a velocity downtrend that started after his no-hitter, and deserves monitoring moving forward. It’s also possible Arrieta intentionally backed off in this start, sacrificing velocity to instead focus on his release point and command:
| Game | Fourseam | Sinker | Change | Slider | Curve |
|---|---|---|---|---|---|
| CHN@ANA (4/4/16) | 95.12 | 94.61 | 88.65 | 90.09 | 80.57 |
| CHN@ARI (4/10/16) | 0.00 | 94.96 | 88.11 | 90.47 | 82.47 |
| COL@CHN (4/16/16) | 95.14 | 94.37 | 88.19 | 89.18 | 81.63 |
| CHN@CIN (4/21/16) | 0.00 | 95.20 | 88.85 | 89.13 | 81.76 |
| MIL@CHN (4/28/16) | 92.34 | 94.57 | 90.00 | 89.89 | 80.83 |
| CHN@PIT (5/3/16) | 93.78 | 93.89 | 89.51 | 87.53 | 79.77 |
His pitch usage has stayed relatively consistent all season, but this outing saw him use his slider and curveball at by far his highest rate of the season. This was likely due to a scouting report on the Pirates suggesting they struggled with offspeed pitches:
| Game | Fourseam | Sinker | Change | Slider | Curve |
|---|---|---|---|---|---|
| CHN@ANA (4/4/16) | 4 | 50 | 3 | 17 | 15 |
| CHN@ARI (4/10/16) | 0 | 59 | 5 | 29 | 6 |
| COL@CHN (4/16/16) | 7 | 56 | 1 | 26 | 10 |
| CHN@CIN (4/21/16) | 0 | 79 | 3 | 23 | 14 |
| MIL@CHN (4/28/16) | 1 | 66 | 3 | 18 | 4 |
| CHN@PIT (5/3/16) | 6 | 45 | 4 | 30 | 14 |
Jon Lester (May 4th, vs. Pittsburgh Pirates)
Result: 5 2/3 IP, W, 0 ER, 8 H, 5 K, 2 BB, 103 pitches
Season: 3-1, 1.58 ERA, 4.22 K/BB, 3.14 FIP, 3.63 DRA
Velocity/Usage/Movement:
| Pitch Type | Count | Freq | Velo (mph) | pfx HMov (in.) | pfx VMov (in.) | H. Rel (ft.) | V. Rel (ft.) |
|---|---|---|---|---|---|---|---|
| Fourseam | 48 | 46.60% | 92.07 | 5.88 | -15.91 | 3.01 | 5.90 |
| Sinker | 12 | 11.65% | 91.42 | 9.19 | -23.56 | 3.12 | 5.83 |
| Change | 6 | 5.83% | 85.28 | 9.39 | -26.73 | 3.06 | 5.91 |
| Curve | 17 | 16.50% | 74.75 | -5.14 | -50.89 | 3.02 | 5.94 |
| Cutter | 19 | 18.45% | 88.00 | 0.10 | -25.16 | 3.10 | 5.87 |
Location:
Observations:
Lester was inefficient in this outing, failing to get through six innings with his 103 pitches. He kept the ball down which limited hard contact, but allowing 10 baserunners won’t often leave you with a scoreless start as this one did. He threw 70 pitches outside of the zone, which has to be some kind of record for a start in which no one crossed the plate. Of the eight hits he allowed, only Josh Harrison’s single registered an exit velocity over 100 mph. He spaced out the baserunners he allowed effectively enough to keep runs off the board, but you certainly can’t rely on that as an ongoing strategy.
Similar to Arrieta, Lester’s release point continues to trend higher, with his vertical movement enjoying gains as a result of the change. Contrary to Arrieta, Lester continues to move towards the first base side of the rubber, indicating he may be attempting to gain a more cross-diagonal release point from the hitters perspective, but doing so without lowering his arm angle as he has in the past. This certainly contributes to lower actual horizontal movement results, but his placement on the rubber may actually make this appear in the opposite manner to the hitter.
Last edition, we noted that Lester was relying on his four-seam fastball more as the season progressed. The trend of heavy usage continued this start:
| Game | Fourseam | Sinker | Change | Curve | Cutter |
|---|---|---|---|---|---|
| CHN@ANA (4/5/16) | 33 | 14 | 9 | 10 | 27 |
| CIN@CHN (4/11/16) | 35 | 20 | 8 | 12 | 27 |
| COL@CHN (4/17/16) | 42 | 11 | 4 | 15 | 27 |
| CHN@CIN (4/22/16) | 48 | 14 | 3 | 13 | 22 |
| ATL@CHN (4/29/16) | 52 | 9 | 3 | 11 | 31 |
| CHN@PIT (5/4/16) | 48 | 12 | 6 | 17 | 19 |
We also witnessed his highest usage rate of his curveball, throwing it 17 times. He still hasn’t allowed a hit on the pitch through six outings. If it ain’t broke, don’t fix it.
Kyle Hendricks (May 5th, vs. Washington Nationals)
Result: 6 IP, W, 0 ER, 2 H, 4 K, 2 BB, 87 pitches
Season: 2-2, 3.10 ERA, 3.83 K/BB, 2.65 FIP, 4.45 DRA
Velocity/Usage/Movement:
| Pitch Type | Count | Freq | Velo (mph) | pfx HMov (in.) | pfx VMov (in.) | H. Rel (ft.) | V. Rel (ft.) |
|---|---|---|---|---|---|---|---|
| Fourseam | 16 | 18.39% | 88.56 | -2.01 | -17.77 | -2.70 | 6.23 |
| Sinker | 47 | 54.02% | 87.65 | -6.78 | -24.80 | -2.54 | 6.30 |
| Change | 17 | 19.54% | 80.49 | -3.43 | -28.85 | -2.61 | 6.28 |
| Curve | 7 | 8.05% | 78.26 | 7.60 | -48.76 | -2.53 | 6.21 |
Location:
Observations:
This was Hendricks’ first start in 10 days, due to rainouts and Joe Maddon’s decision to skip his last turn in the rotation. The results of this outing were better than than actual outing, as Hendricks possessed neither swing-and-miss stuff nor his trademark command. He threw 20 pitches in the middle portion of the zone, with nine of them registering right down the middle. The pitch-plot paints a scary picture:
A pitcher that lacks velocity as Hendricks does cannot maintain effectiveness with a plot like this, as eventually hitters will connect with hard contact. Nationals’ hitters managed exit velocity greater than 100 mph three different times, but thankfully for Hendricks they all stayed in the ballpark. He only managed five whiffs, which means he was rather fortuitous on balls-in-play.
A positive indicator (besides the successful results) to point out is that Hendricks was able to maintain velocity in the later innings, even reaching back to touch 90 mph in his final inning of work:
This is a part of a subtle but exciting trend for Hendricks, one that has seen his velocity slowly edge up over his last three starts. It may not seem like much, but the difference between 87.7 mph and 88.5 mph is actually rather significant. It’ll be interesting to see wither Hendricks can maintain this velocity without sacrificing command:
| Game | Fourseam | Sinker | Change | Curve |
|---|---|---|---|---|
| CHN@ARI (4/9/16) | 89.38 | 87.48 | 80.14 | 78.66 |
| COL@CHN (4/15/16) | 87.75 | 87.53 | 79.80 | 77.94 |
| CHN@SLN (4/20/16) | 87.89 | 87.48 | 80.30 | 78.64 |
| MIL@CHN (4/26/16) | 87.92 | 87.50 | 80.40 | 78.21 |
| WAS@CHN (5/5/16) | 88.56 | 87.65 | 80.49 | 78.26 |
John Lackey (May 6th, vs. Washington Nationals)
Result: 7 IP, W, 2 ER, 6 H, 11 K, 1 BB, 111 pitches
Season: 4-1, 4.02 ERA, 4.00 K/BB, 3.19 FIP, 3.68 DRA
Velocity/Usage/Movement:
| Pitch Type | Count | Freq | Velo (mph) | pfx HMov (in.) | pfx VMov (in.) | H. Rel (ft.) | V. Rel (ft.) |
|---|---|---|---|---|---|---|---|
| Fourseam | 42 | 37.84% | 92.75 | -3.34 | -16.38 | -2.65 | 6.22 |
| Sinker | 28 | 25.23% | 92.94 | -9.72 | -23.15 | -2.80 | 5.85 |
| Change | 6 | 5.41% | 85.64 | -9.62 | -27.81 | -2.26 | 6.27 |
| Slider | 17 | 15.32% | 83.63 | 3.68 | -36.99 | -2.26 | 6.34 |
| Curve | 18 | 16.22% | 80.13 | 5.23 | -47.16 | -2.36 | 6.42 |
Location:
Observations:
Lackey gave up two runs, but this may have been his strongest outing of the year. The 11 strikeouts he generated were a season high, while the 16 whiffs and 61 SNIPs were also his best tallies of the year. The day didn’t start so well, as Lackey left a sinker up in the zone to Anthony Rendon batting second in the order:
Rendon has had a tough season, but he didn’t miss this one, launching the mistake into the left field bleachers:
Thankfully for the Cubs on what was a hitter-friendly day (the Cubs managed to hit four home runs off Max Scherzer), Lackey kept the ball down most of the rest of the start, and did not allow another long ball. It was a day that rewarded missing bats, and Lackey’s proficiency in this area allowed him limit damage and collect a win.
We’ve discussed Lackey’s inability to maintain velocity through the middle innings, but this outing represented a departure from that trend:
Where he had been seeing a drop in velocity around the 60-pitch mark, Lackey was able to maintain consistency until the mid-90’s mark this time around. This is an important indicator of his ability to pitch late into the game, as the results followed his velocity, as just one Nats hitter reached base in the sixth and seventh innings combined. This marked a reversal of Lackey’s early season trend of struggling after the fifth inning, which is no doubt a welcome sight for Maddon, as this will assist with keeping mileage off of the bullpen.
Jason Hammel (May 7th, vs. Washington Nationals)
Result: 5 IP, ND, 3 ER, 4 H, 3 K, 4 BB, 97 pitches
Season: 4-0, 1.85 ERA, 2.00 K/BB, 3.21 FIP, 5.05 DRA
Velocity/Usage/Movement:
| Pitch Type | Count | Freq | Velo (mph) | pfx HMov (in.) | pfx VMov (in.) | H. Rel (ft.) | V. Rel (ft.) |
|---|---|---|---|---|---|---|---|
| Fourseam | 28 | 28.87% | 92.42 | -4.23 | -14.64 | -2.06 | 6.59 |
| Sinker | 10 | 10.31% | 92.30 | -7.83 | -19.71 | -2.16 | 6.50 |
| Change | 3 | 3.09% | 85.73 | -7.32 | -24.96 | -2.22 | 6.31 |
| Slider | 34 | 35.05% | 84.28 | 3.52 | -36.50 | -2.10 | 6.63 |
| Curve | 22 | 22.68% | 76.81 | 6.49 | -54.01 | -2.09 | 6.50 |
Location:
Observations:
This was another inefficient outing for Hammel, which is a bit of a developing trend. It’s great to see him get back to working high and inside, but leaving 10 pitches down the middle of zone suggests his command wasn’t sharp enough to do so effectively. Check out the heatmap from this outing for a visual aide:
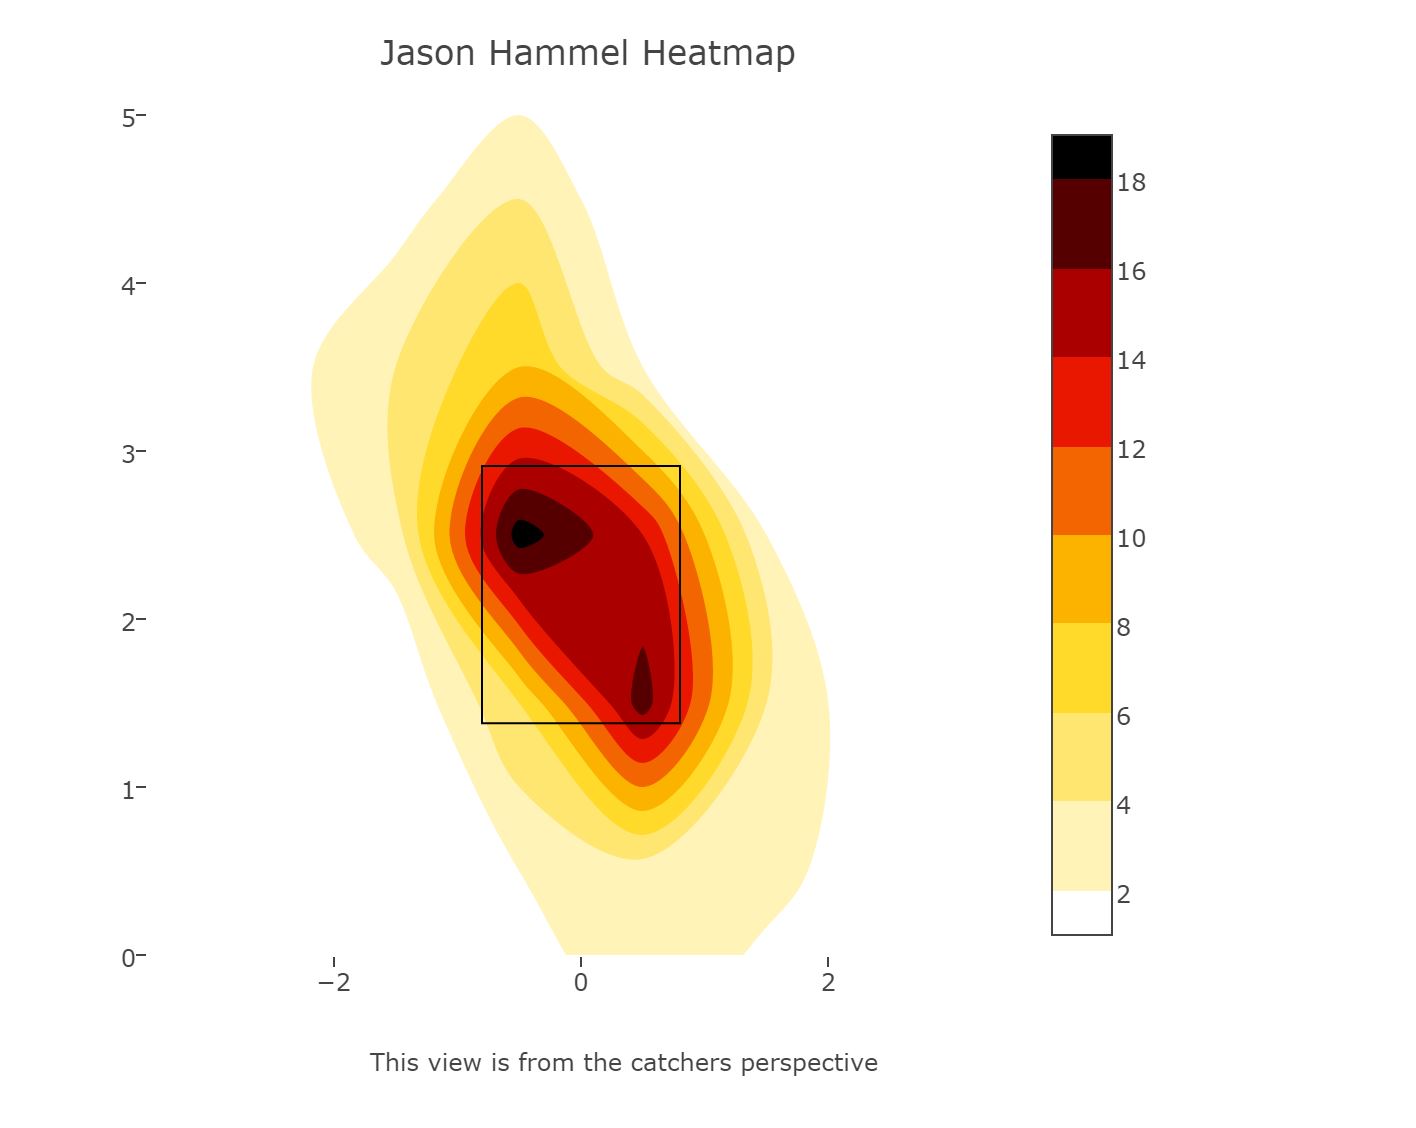
Ideally what Hammel is trying to achieve is a hot spot on the upper-inner and lower-outer corners, with limited pitches left in-between. In this case, he grouped pitches on both edges, but left too many right in the center. For the first time in three starts, he did generate one single popup, but he really needs to start reducing the free passes he allows, or his elevated DRA will catch up with him.
Hammel did slightly reduce his slider usage this game, but it came along with an extreme jump in throwing his curveball. The two pitches combined for nearly 57 percent of his offerings, a total that seems unsustainable if he expects to maintain succes. He threw just 38 total fastballs, something I do not believe he can get away with long term, as setting up your breaking pitches with fastballs is vital to keeping hitters off-balance:
| Game | Fourseam | Sinker | Change | Slider | Curve |
|---|---|---|---|---|---|
| CHN@ARI (4/8/16) | 34 | 6 | 6 | 31 | 12 |
| CIN@CHN (4/14/16) | 39 | 16 | 0 | 21 | 12 |
| CHN@SLN (4/19/16) | 17 | 31 | 4 | 14 | 18 |
| CHN@CIN (4/24/16) | 24 | 26 | 0 | 39 | 7 |
| CHN@PIT (5/2/16) | 15 | 31 | 2 | 38 | 3 |
| WAS@CHN (5/7/16) | 28 | 10 | 3 | 34 | 22 |
His velocity was also significantly lower, as his average fastball dipped back into the mid-92 mph range. This could be relatively normal deviation, or it could point to too many offspeed pitches affecting his velocity. Let’s keep an eye on this as we move forward:
| Game | Fourseam | Sinker | Change | Slider | Curve |
|---|---|---|---|---|---|
| CHN@ARI (4/8/16) | 91.75 | 92.17 | 84.48 | 84.40 | 76.84 |
| CIN@CHN (4/14/16) | 91.26 | 91.83 | 0.00 | 83.59 | 76.35 |
| CHN@SLN (4/19/16) | 93.05 | 93.04 | 85.36 | 85.18 | 77.72 |
| CHN@CIN (4/24/16) | 94.00 | 93.70 | 0.00 | 86.28 | 78.55 |
| CHN@PIT (5/2/16) | 93.89 | 93.71 | 85.67 | 85.37 | 77.19 |
| WAS@CHN (5/7/16) | 92.42 | 92.30 | 85.73 | 84.28 | 76.81 |
A note from the author: This will be the last episode of Pitching Progress, as I will be devoting my time to other projects.
Lead photo courtesy Dennis Wierzbicki—USA Today Sports.
On Arrieta: “This coincides with a velocity downtrend that started after his no-hitter, and deserves monitoring moving forward.”
It appears from the pitch velocity chart that it trends downward ever so slightly as the pitch count went up. I, like you, am cautiously optimistic that there are no long term effects from the no-hitter, and in this case I am also thinking this was a relatively low stress outing given the Cubs had a nice 6-0 lead after the top of the 4th.