What is Statcast? Loyal readers of Baseball Prospectus have at least a rudimentary understanding of it, while major league baseball’s casual viewers probably think it’s the name of Outkast’s new album. In other words, it’s old enough that you won’t think twice when you see it on your Twitter feed, but it’s new enough that your Grandpa/Uncle hasn’t started complaining that it’s ruining baseball yet. In reality Statcast (per MLB) is a “state-of-the-art tracking technology, capable of measuring previously unquantifiable aspects of the game. Set up in all 30 Major League ballparks, Statcast collects data using a series of high-resolution optical cameras along with radar equipment. The technology precisely tracks the location and movements of the ball and every player on the field, resulting in an unparalleled amount of information covering everything from the pitcher to the batter to baserunners and defensive players.” It’s not an exaggeration to say that a lot of the sabermetrics concepts that have been used over the past fifteen to twenty years could be replaced by new concepts born out of Statcast data. Stats like Park-Adjusted Defensive Efficiency (PADE) and Ultimate Zone Rating (UZR) could be refined to include the exact amount of ground covered to make a defensive play, stats like wOBA and tAV could be adjusted to include exit velocity and launch angle, and concepts like defense independent pitching metrics could become obsolete. But before you place FIP in the same evaluation category as pitcher wins, you need to understand the following things about Statcast:
- Since it’s only been in place for just under two years, Statcast misses some things.
- Even though it tracks just about everything that happens on the field, only a very small portion of that data has been released for public consumption.
While it would be nice to know the exact amount of ground covered on each of Jason Heyward’s highlight reel catches or the speed of each of Javy Baez’s bare handed throws to first; there’s more than enough Statcast data available to evaluate the soon to be 2016 NL Central Division Champions Chicago Cubs. In the next section I’ll give a brief summary of how I compiled the Statcast data in case anyone wants to do their own analysis. If this isn’t your thing and you just want to to see the Cub’s Statcast results scroll down to the exit velocity and launch angle plots. All Statcast data is available via baseballsavant.mlb.com, which is run by Daren Willman, with an assist from Tom Tango and others. Now, let’s dig in to see the results.
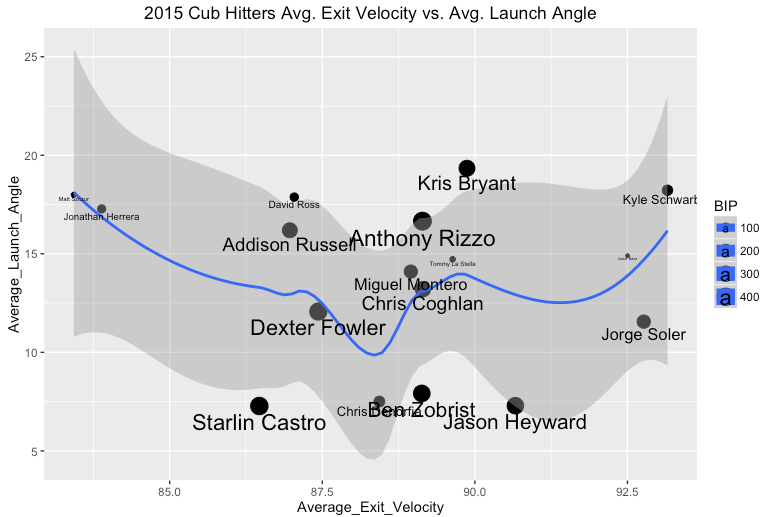
Above, I’ve plotted the average exit velocity and launch angle for each significant Cub position player in 2015 vs. 2016. Please note the size of the players data point/name is in conjunction with the amount of balls they put in play. For comparison purposes I also included Ben Zobrist’s and Jason Heyward’s 2015 results throughout. Not a ton of surprises here. On the plus side Anthony Rizzo, Kris Bryant, Dexter Fowler, and Ben Zobrist are all hitting the ball harder (and at optimal launch angles) in 2016 than they did a year ago (though in Zobrist’s case this is likely being enhanced by his scorching May). Additionally, Jorge Soler continues to be a Statcast darling, outpacing Bryant and Rizzo for the second year in a row. On the minus side Kyle Schwarber is the Cubs’ dugout presence instead of left fielder/catcher, while Jason Heyward has taken up Starlin Castro’s spot as the disappointing Cubs regular who can’t make hard contact. Interestingly enough, the Statcast data shows that Jason Heyward’s average launch angle has actually improved in 2016 vs. 2015 (when it was hovering around seven and half degrees); however this improvement has come at the dramatic expense of his overall average exit velocity figures, which have gone from nearly 91 mph in 2015 to just over 87 mph in 2016. So, next time you see someone on Twitter complain about Heyward weakly grounding out to second base again, kindly respond that Heyward has actually been more likely to softly popout just beyond the infield, and then silently pray that the Cubs can avoid the deadly lefty triumvirate of Kershaw/Bumgarner/Rich Hill (!!!).
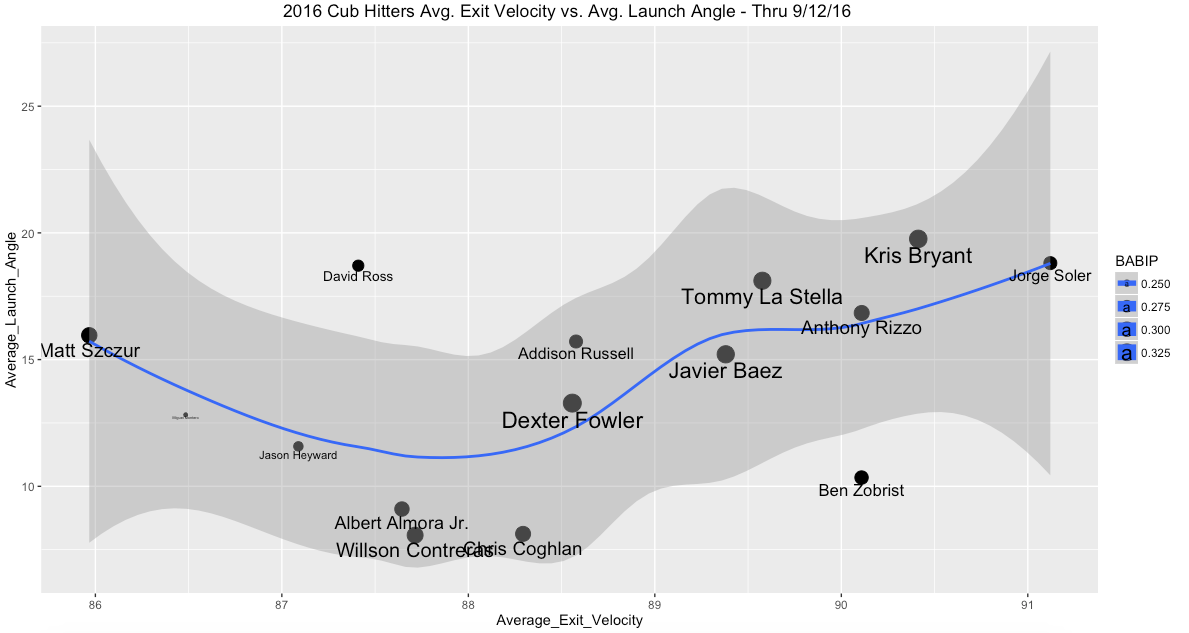
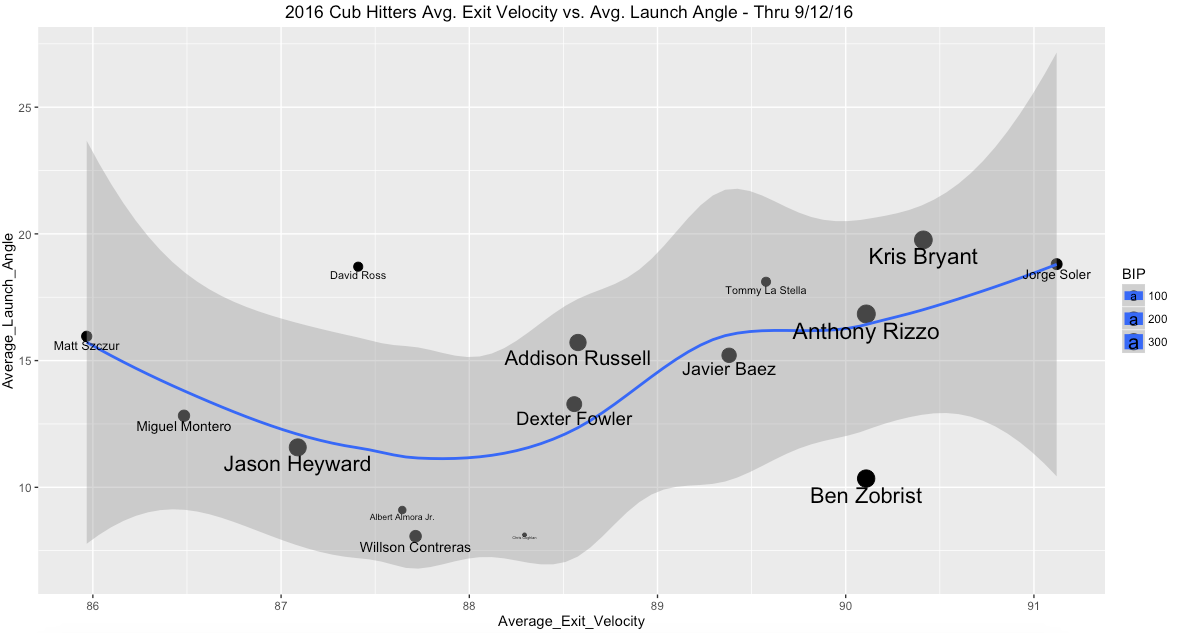
Above I’ve plotted the average exit velocity and launch angle for each significant Cub position player in 2015 vs. 2016. Please note the size of the player’s data point/name is in conjunction with the size of that player’s BABIP for each period. You can see that, for the most part, when players (i.e. Kris Bryant and Jorge Soler) consistently hit the ball hard it tends to to drop for hits, which allows that player to maintain a higher than normal BABIP. Where this doesn’t hold true is when a player’s launch angle (i.e. Jason Heyward 2015 season) has shrunk below ten degrees (the dividing line between line drive vs. ground ball). A lot of this seems like common sense: players who hit the ball hard generally have more hits vs. players who hit more ground balls tend to make more outs. But it’s another reminder that if a player has a low BABIP (like Jason Heyward this year or Starlin Castro in 2015), it won’t make magically return to the player’s career norms without the return of hard contact.
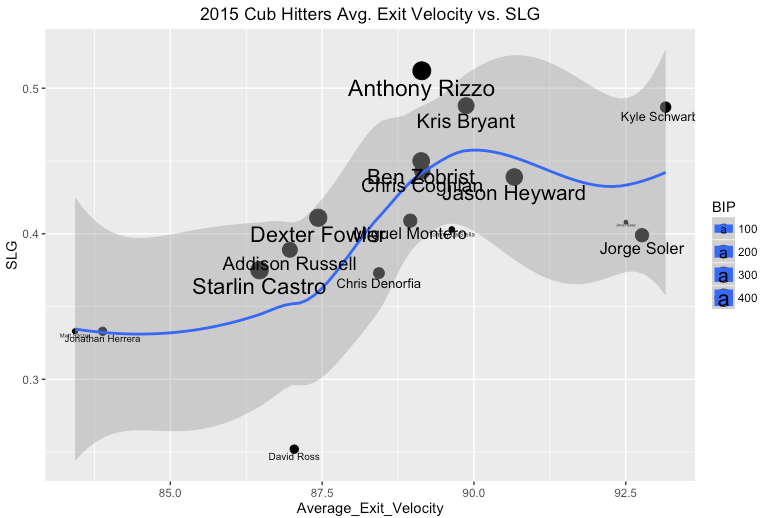
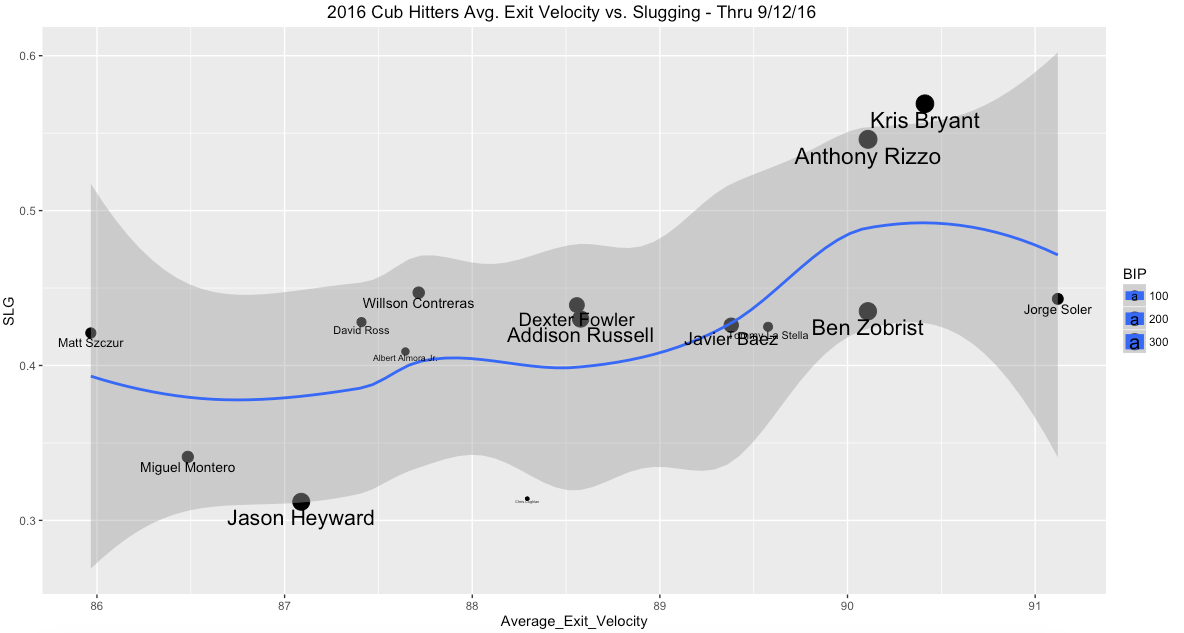
Above I’ve plotted the average exit velocity and slugging percentage for each significant Cub position player in 2015 vs. 2016. Please note the size of the player’s data point/name is in conjunction with the amount of balls they put in play. These plots show the strongest linear relationship yet; when average exit velocity increases, the player’s slugging percentage increases as well. In 2015 it looks like Anthony Rizzo outperformed his average exit velocity, perhaps this occurred because of Rizzo going the other way on the shift and turning what usually would have been ground balls to the third baseman into doubles. Of more pertinent concern is the fate of Matt Szczur who is in contention for a spot of the playoff roster. Szczur’s average exit velocity, which is lower than Miguel Montero’s and Jason Heyward’s (albeit in a smaller sample size), doesn’t support him having the .421 slugging percentage that he currently possesses.
Finally, I’ve included plots that have Cub hitters’ average launch angle and average exit velocity for fastballs (sinker, four seam, two seam, cutters), breaking pitches (curve balls, sliders), and offspeed pitches (changeups, splitters).


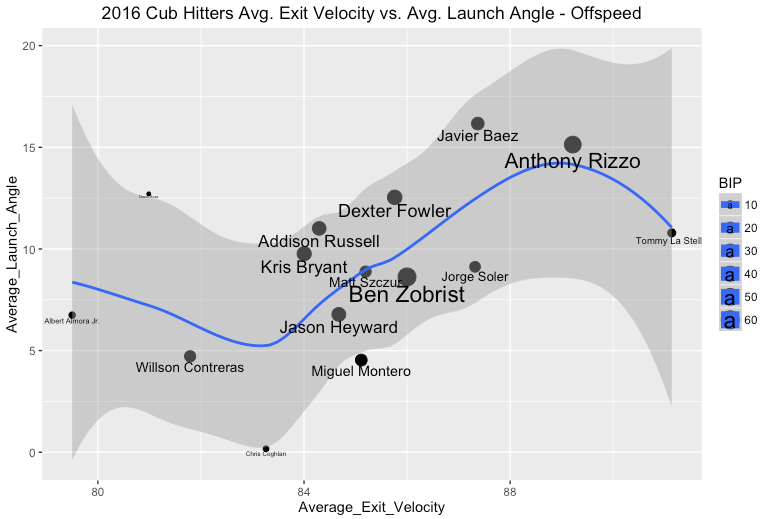
Since these are all pretty small samples I won’t go to in depth on them. Here are some things that stuck out to me:
- Zobrist, Bryant, and Soler are the Cubs’ best fastball hitters in 2016.
- As part of his ascension into a year in and year out MVP candidate, Anthony Rizzo has led the team in average exit velocity against breaking and offspeed pitches, in conjunction with…
- Tommy La Stella. I knew he had been having a good season, I didn’t know he had been pacing an elite offensive team in average exit velocity for both breaking and offspeed pitches.
- Kris Bryant still looks ordinary against changeups (average exit velocity is approximately 84 mph). Expect him to get a heavy dose of these in the playoffs.
Now let’s talk about Statcast and the Cubs’ pitching. If you’ve been following the 2016 Cubs you know that the pitching staff (specifically the starting staff) has been very good. But depending on who you talk to, the Cubs’ pitching staff is being overshadowed by the Cubs’ defense, which has been historic. So who deserves the credit for the Cubs’ run prevention in 2016? Let’s look into the Statcast data to try and find out.
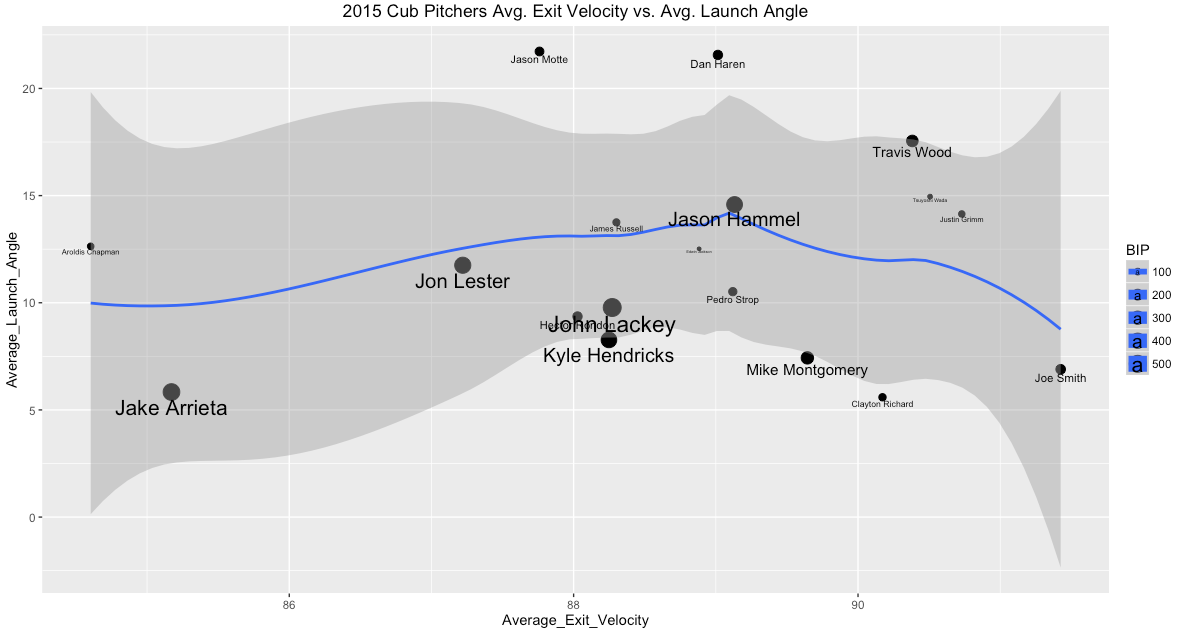
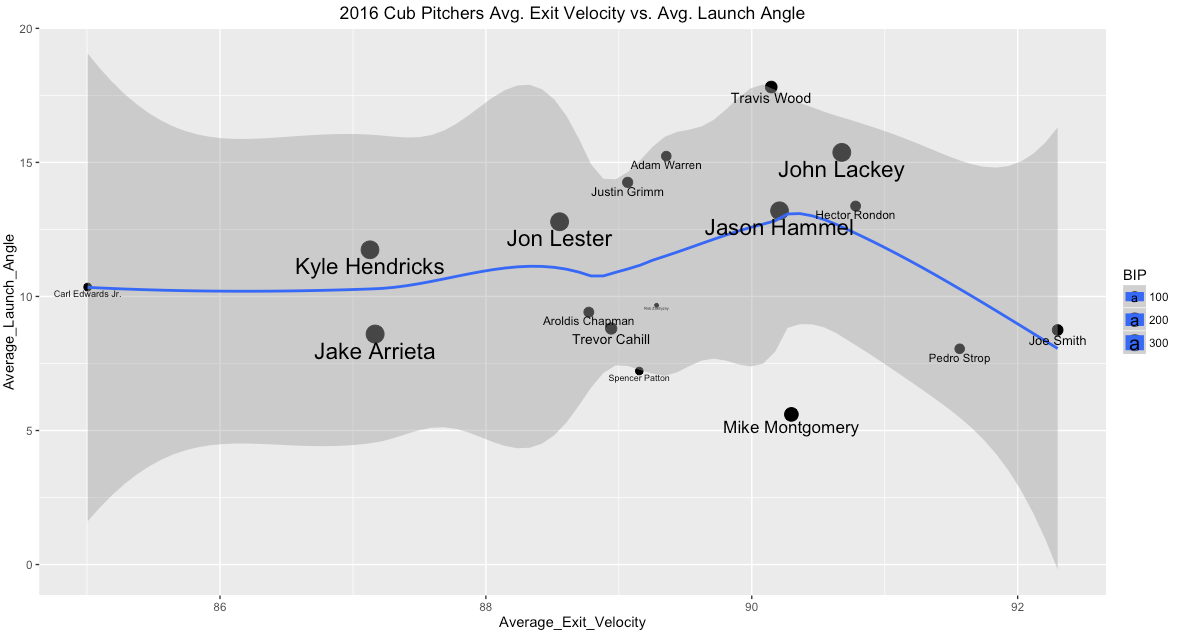
Above, I’ve plotted the average exit velocity and launch angle for each significant Cub pitcher in 2015 vs. 2016. Please note the size of the player’s data point/name is in conjunction with the amount of balls they have allowed in play. For comparison purposes I also included Aroldis Chapman, Jon Lackey, Mike Montgomery, and Joe Smith’s 2015 results throughout. Even a year later it’s still remarkable to look at how much soft contact Jake Arrieta was generating in 2015, and I’m guessing if I broke this out by only the second half of 2015 it would be even lower. Alas, like all of the other metrics Statcast shows that Jake Arrieta has fallen from the ranks of best pitcher alive in 2015 to simply a very good pitcher in 2016. Luckily for the Cubs, Kyle Hendricks has lowered his average exit velocity by almost a full mph in 2016 compared to his 2015 results. Hendricks currently leads the Cubs’ starting staff in average exit velocity allowed (just over 87 mph). If you want to build a case for Hendricks to win the Cy Young, or simply want to know how he transformed from a fourth starter into the NL leader in ERA, this is where you should start.
John Lackey and Jason Hammel both had their average exit velocity increase to over 90 mph in 2016 (compared to just over 88 and 89 mph in 2015), yet their overall traditional pitching metrics looked just as solid (or in Hammel’s case better) than their 2015 results. Each of these pitchers owe some of their 2016 success to the outstanding Cubs defense. Perhaps no Cubs pitcher should be more thankful to the defense (especially having Javy Baez at third base) than Jon Lester, who just one year after being thoroughly displaced as the Cubs’ ace by Jake Arrieta looks to be in contention for the NL Cy Young award and a Game One NLDS start, despite giving up a slightly higher average exit velocity in 2016 vs. 2015. Finally, after years of monitoring his potential, it’s heartening to see Carl Edwards, Jr. look like a future closer out of the pen. Edwards currently leads Cubs pitchers in average exit velocity given up, clocking in at just over eighty five mph.
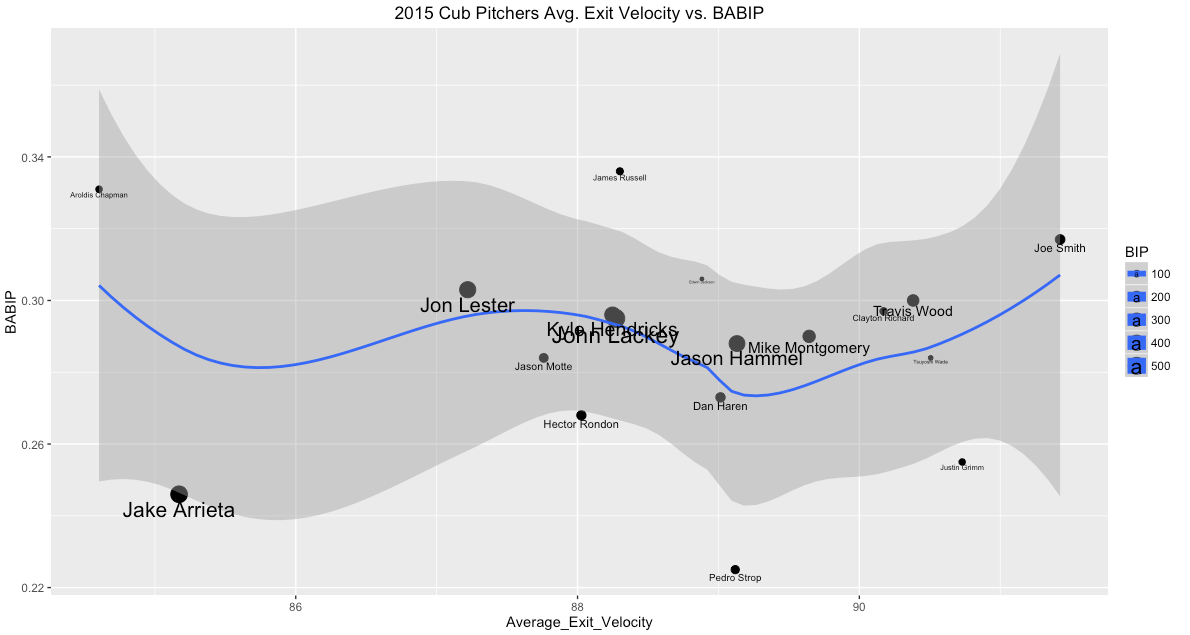

Above, I’ve plotted the average exit velocity and BABIP for each significant Cub pitcher in 2015 vs. 2016. Please note the size of the player’s data point/name is in conjunction with the amount of balls they have allowed in play. These plots at times support the idea that a pitcher’s BABIP is impacted by exit velocity given up, with Carl Edward, Jr.’s looking to be mostly responsible for his .150 BABIP in 2016 with his superb average exit velocity. This is similar to Jake Arrieta’s exit velocity and BABIP relationship in 2015. On the other hand, Hammel and Lackey both buck the linear trend between average exit velocity allowed and BABIP as each pitcher gave up a higher average exit velocity in 2016 vs. 2015, but incurred a lower BABIP. And it’s not just these two; none of the pitchers I plotted has a BABIP allowed greater than .300, which has long been considered to be the average for pitchers. Even if the defensive Statcast data is not publicly available, it’s pretty clear that what the Cubs defense is doing is highly unprecedented.
Lead photo courtesy Jeff Curry—USA Today Sports.
Got to love an article, that will take a couple different times to get though and understand the info.