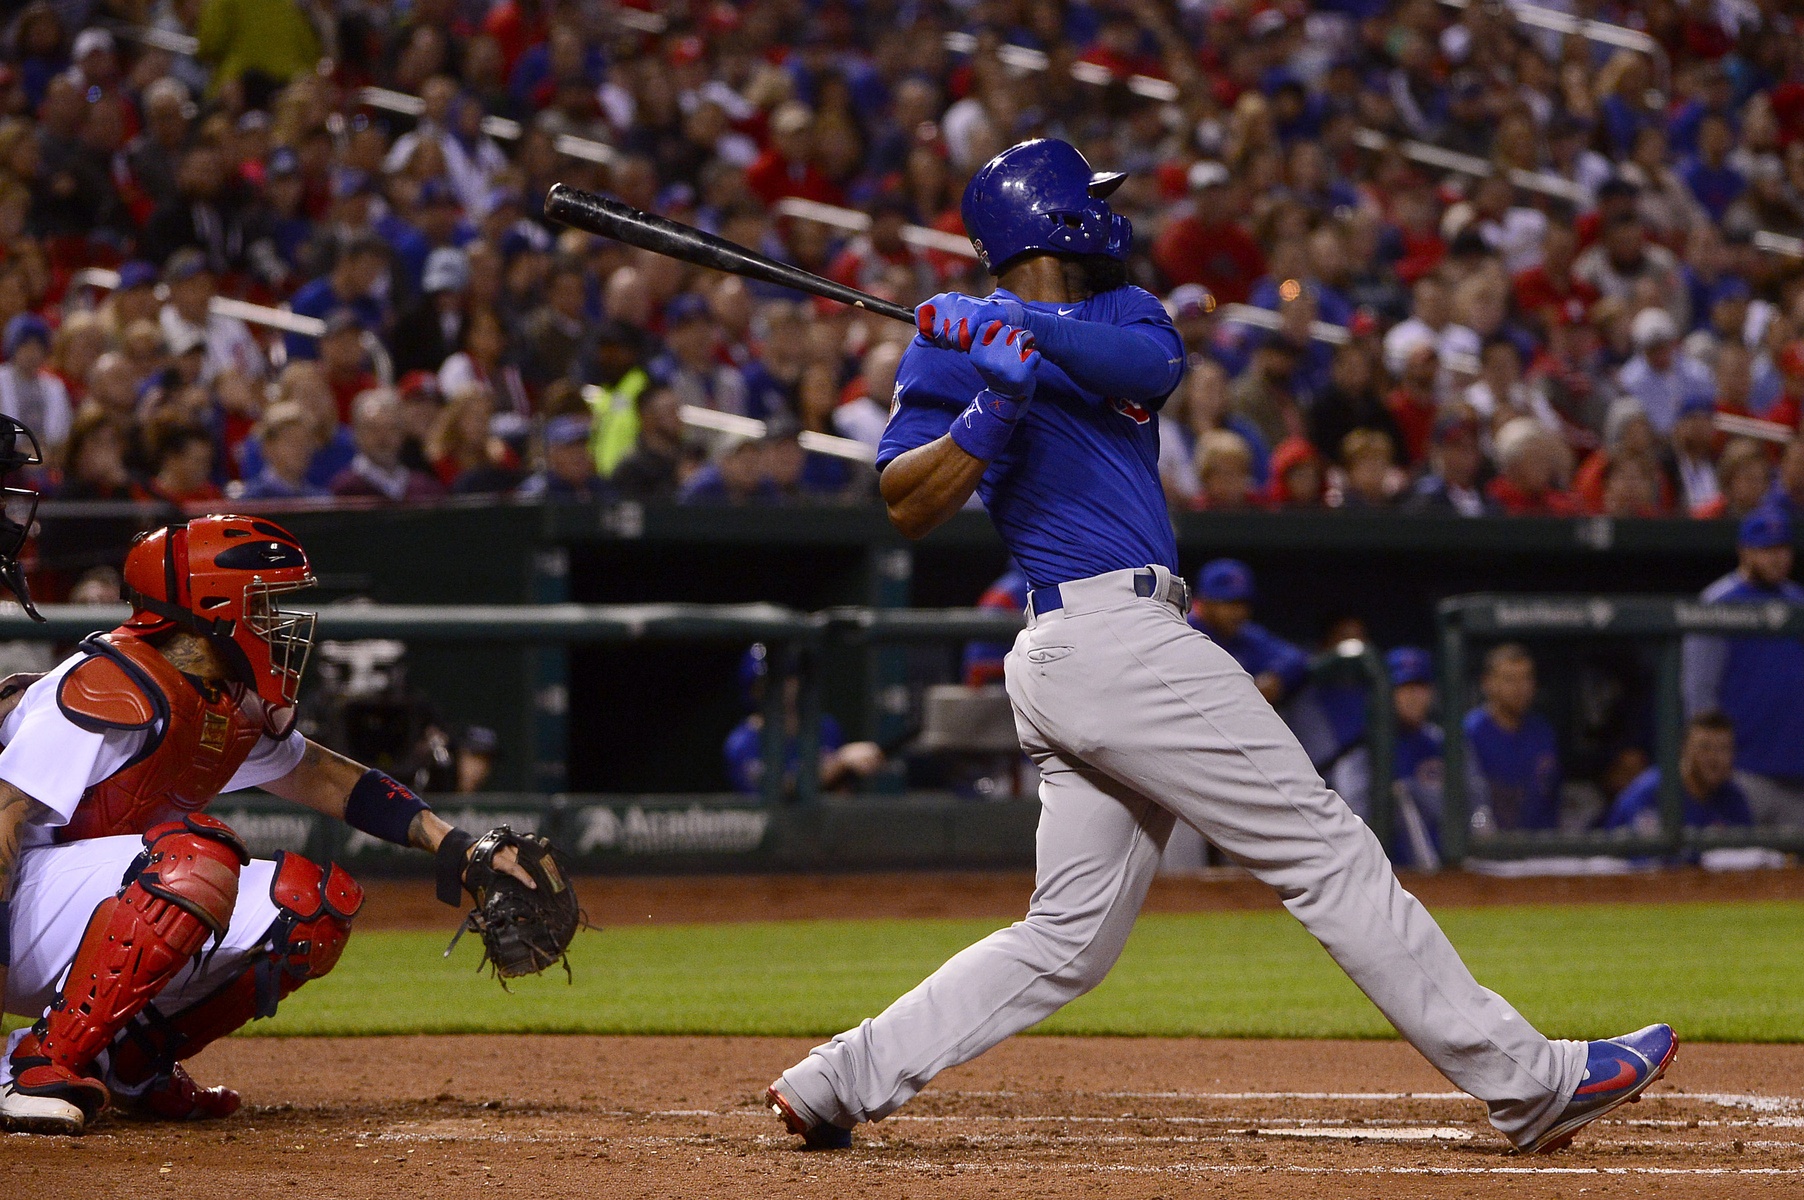
You knew that Jason Heyward was going to be under a microscope in 2017. After the Cubs handed him the contract that they did, only for him to morph into a helpless presence at the plate in 2016, he was going to be under intense scrutiny for every soft groundball to second base in the new campaign, elite defense be damned. Which is why we’re barely a week into the year and already here to analyze how evident some of the changes have been for him thus far.
The good news is that it’s all good news.
Obviously, it’s difficult to put any real stock in early season statistics. Heyward has a long way to go before his average and OBP, as well as some of the power figures, stabilize over the course of the season. At the same time, there are some early trends here that would certainly appear to bode well for the Cubs’ right fielder moving forward. But before we divulge some of those positive trends, let’s quickly jump back to review the travesty that was Heyward’s offensive performance in 2016.
It was a season that featured a .230 average and .306 on-base percentage, for starters. It was Heyward’s lowest batting average since 2011 and his lowest OBP rate of his career. He came in with an ISO of just .094, providing virtually nothing in the power game, while posting a TAv that also represented a career low by a pretty significant margin. Bad news up and down the board, as has been well-documented to this point.
You’re going to be seeing a lot of that throughout the season. Graphics and lines showing what Heyward did last year, likely compared to what he’s turning in this year. This is especially likely to be true as the improvements that he’s demonstrated to this point continue, as an uptick in his play at the plate will almost certainly result in the elimination of the narrative of Jason Heyward as a glove-only player that was birthed last year.
The good news is that many of his peripheral figures remained constant. His strikeout and walk rates, at 15.7 and 9.1, respectively, fell in line with his career averages. His contact and whiff rates also remained relatively even with his typical career output. Without getting too far into it, there were simply some glaring mechanical flaws that prevented Heyward from making quality contact with any sort of consistency in 2016.
As such, here is where Heyward stood in regard to a number of contact trends throughout that brutal 2016 campaign:
| Swing% | Contact% | SwStr% | LD% | GB% | FB% | Soft% | Hard% |
|---|---|---|---|---|---|---|---|
| 38.0 | 82.8 | 17.2 | 20.5 | 46.2 | 33.3 | 27.0 | 26.4 |
That soft contact rate trailed only that 2011 season for the highest mark of his career, while the 26.4 percent hard hit rate was tied for the lowest of his career. While it seemed like every Heyward plate appearance resulted in a groundball to second, it was his flyball rate that actually jumped up from 2015 to 2016. Combine that with the soft contact rate, and it’s no wonder he struggled as much as he did.
Obviously, the good news with that is what we’ve seen from Heyward to this point in 2017. Bear in mind that we’re dealing with a minuscule sample, but considering how evident Heyward’s struggles were almost immediately last season, it’s never too easy to dig for optimism in regard to the Cubs’ right fielder.
Through 23 plate appearances headed into Monday’s festivities, Heyward’s slash featured a .333 average and .391 on-base percentage. Ultimately, that’s not what we’re worried about, though. Given that his struggles came largely as a result of his inability to make hard contact, that’s where our attention is directed. And with a 40.0% hard hit rate through the season’s first six games, one has to imagine his start will bode well for a rebound year in 2017.
His contact rate is up above 90 percent, and he’s also swinging the bat at a rate higher than normal, with a Swing% of 46.2, which would represent his highest mark since 2012. That element of it will be something to keep in mind moving forward, but Heyward’s approach has never been in question.
At no point have these changes been more evident than his Sunday outing against the Milwaukee Brewers, in which Heyward made contact with exit velocities over 95 mph in each of his five plate appearances. Now, not all resulted in hits, and that’s the nature of the game. But it certainly could be a sign of things to come from Heyward. If anything, the confidence boost he should be experiencing with strong contact throughout the spring and similar results early in the season, should be a factor in the rebound.
You’ve read about Jason Heyward’s changed/improved mechanics: the dropped hands, elimination of the hitch, etc. You’ve seen folks overanalyze it. What we’re seeing right now is the result of that work that Heyward put in during the offseason and the spring. It’s difficult to quantify confidence, but we can look at his contact trends early in the season, and it sure as hell looks good from where we’re sitting moving forward.
This won’t be the last time we talk about the adjustments and statistical improvements. Maybe not even this week.
**Contact Type figures via FanGraphs
Lead photo courtesy Jeff Curry—USA Today Sports

Thank you. And yes; we are all very interested in periodic updates! lol