$228 million. That’s how much money was spent on three elite relievers this past offseason, which one could argue is less than absurd amount of prospect/young player value that contending teams have been forced to give up during the past eighteen months in order to shore up their respective bullpens. This reliever bull market is further proof that the later innings of the game, and how organizations construct their pitching staffs, have undeniably changed. Each year managers dip into the bullpen earlier and earlier, and as a consequence relievers are pitching more innings than ever. Given the performances of the likes of Andrew Miller, Cody Allen, and Kenley Jansen during the 2016 postseason, this trend is unlikely to abate as even stalwarts who had held out in the past are now willing to pitch multiple innings. To top it all off, managers today are much more adept at maximizing their reliever’s value than in the past. So teams can play the odds and hope for a relief pitcher to make a mistake, but since the 1973 major league season, of the 100 pitchers with the highest strikeout rate minus walk rate, 60 of them were relief pitchers from 2010-2016. Everything about the 2016 playoffs, from the first game to the last game, seem to signify a permanent shift. Simply put, Andrew Miller changed bullpens forever, and it’s likely that MLB teams will try and copy this model either through outside acquisitions or internal development. So if we accept that relievers are pitching better than ever, more than ever, and in the highest leverage situations, what can opposing teams (specifically the Cubs) do to combat this? We may have already seen it in the 2016 World Series when the Cubs and the Indians attempted a combined fifteen stolen base attempts, with twelve of them being successful. The 2016 World Series base running prowess wasn’t a fluke either, it’s part of a larger trend ongoing trend in recent years in the postseason.
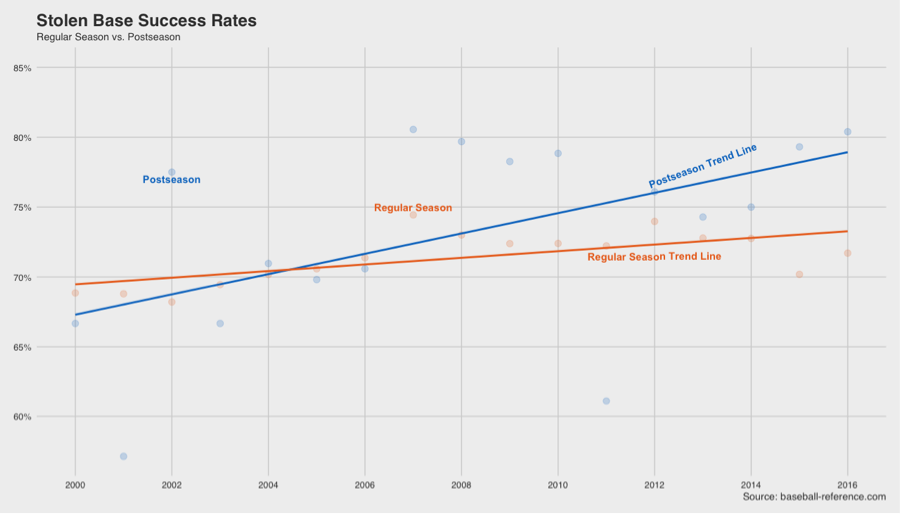
Besides 2011, stolen base success rates have been higher in the postseason compared to the regular season for each postseason since 2007. What’s more is that this isn’t just a case of teams trying to steal second in the third inning to avoid the double play with the pitcher coming up. Below I’ve taken the average leverage index values for stolen base attempts for the postseason vs. the regular season dating back to 2012.
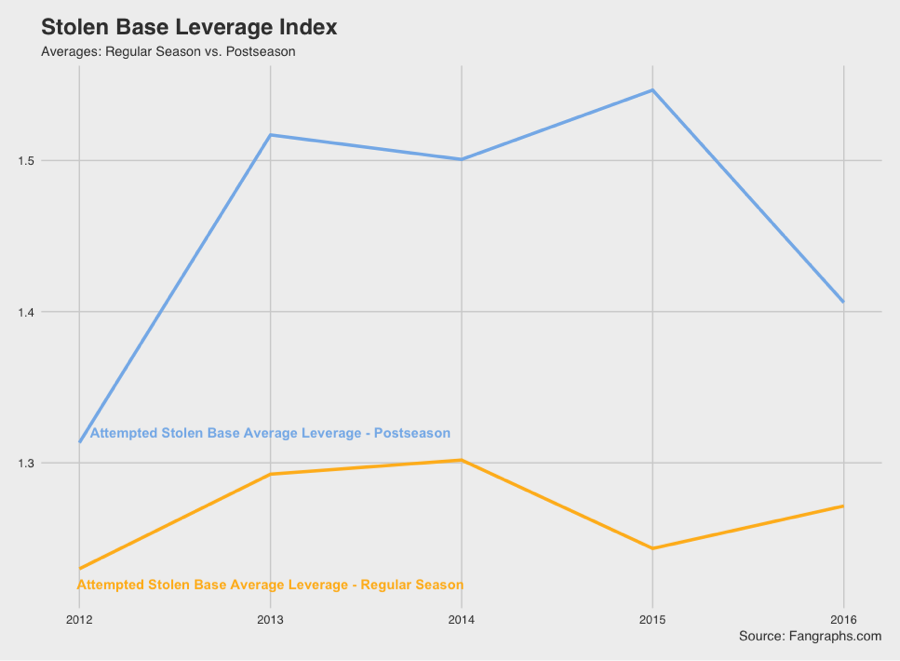
Since 2012, teams have been much more apt to attempt stolen bases during high pressure moments during the playoffs than during the regular season. Note these are the same high pressure moments that managers are increasingly pulling their starters from in the playoffs, instead placing their trust in their relievers. Thus if teams are going to utilize their stud relievers in the regular season like they have in the postseason (i.e. use a closer despite not having the lead – which Buck Showalter and Mike Matheny have already done this April), perhaps the next shoe to drop will be that the aggressive high leverage base running that has existed in the playoffs will begin to be seen in the regular season. Following this logic there are two questions that pertain to the 2017 Cubs team:
1.) Which relievers are most susceptible to be stolen upon?
2.) Which Cubs player is best at high leverage base running?
To answer the first question I looked at the BP swipe rate above average (SRAA) statistic which “uses a generalized linear mixed model and simultaneously weights all participants involved in attempted steals against each other, and then determines the likelihood of the base ending up as stolen, as compared to the involvement of a league-average pitcher, catcher, or lead runner, respectively.” To try and avoid any single outliers I calculated each non-starting pitchers three year weighted average (weighted by innings pitched) SRAA. To determine which non-starting pitchers would be most likely to pitch in high leverage situations I utilized the 2017 player PECOTA WARP (as of April 8, 2017) projections. Below I’ve plotted these two attributes together for National League relievers by their respective teams, separated by division. A couple of things to take note of when looking at these plots—the first is that the three year weighted average SRAA (plotted on the y-axis) is calculated so that average is equal to zero. Thus any relief pitcher above the dotted line is below average at holding runners. Second, to avoid over-plotting I’ve only listed the last names of relief pitchers who are projected to achieve greater than or equal to 0.2 WARP during 2017. Thus since this analysis looks for excellent relievers whom the Cubs could possibly exploit on the base paths, those pitchers that fall further to the right and above the dotted line will be most relevant.
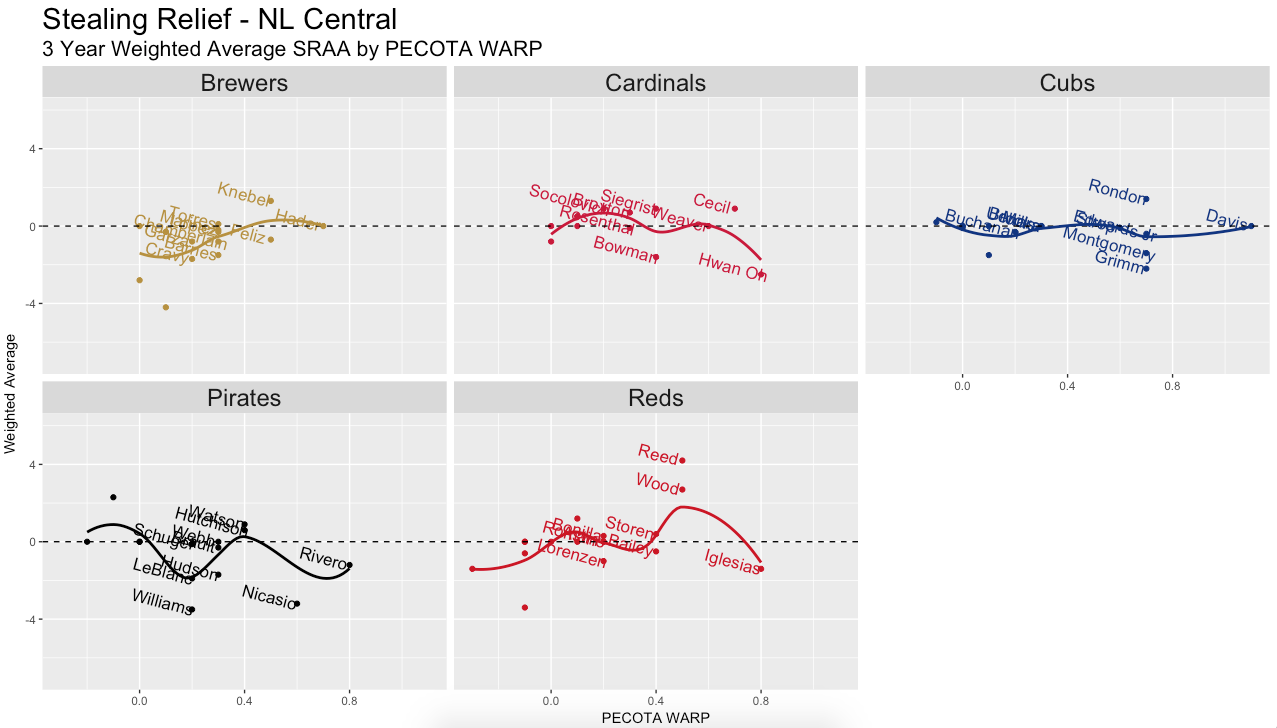
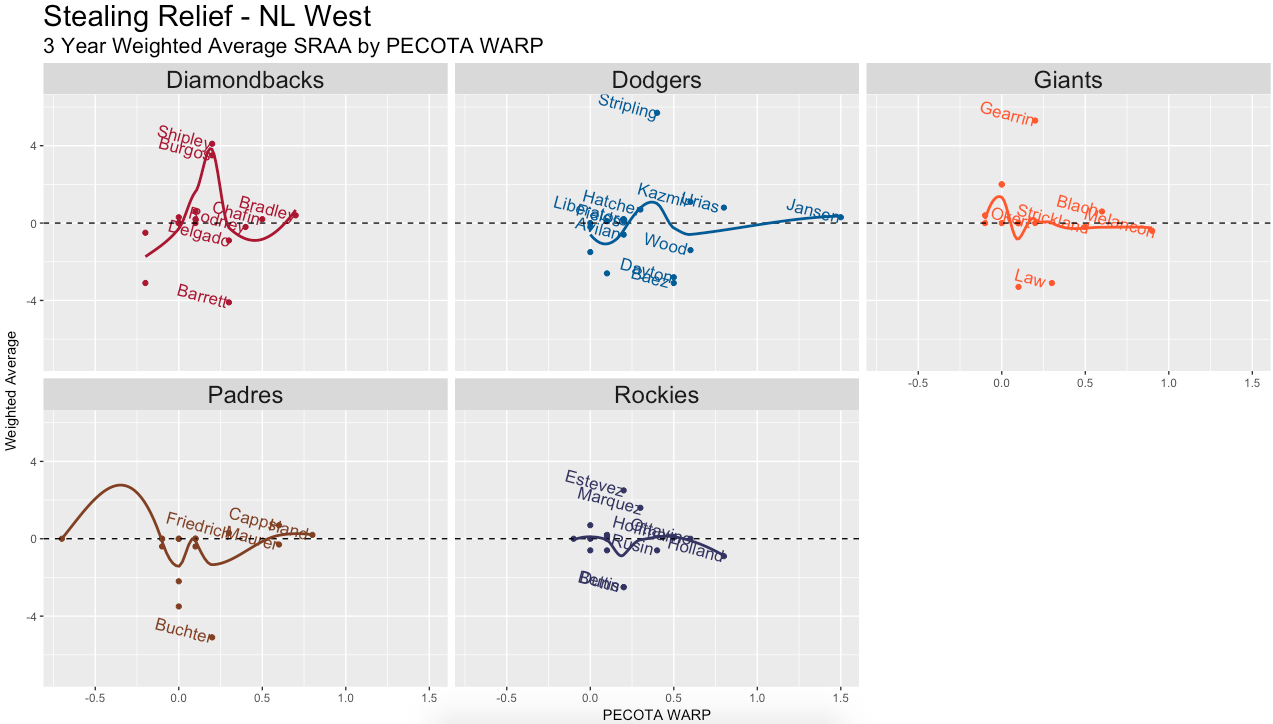
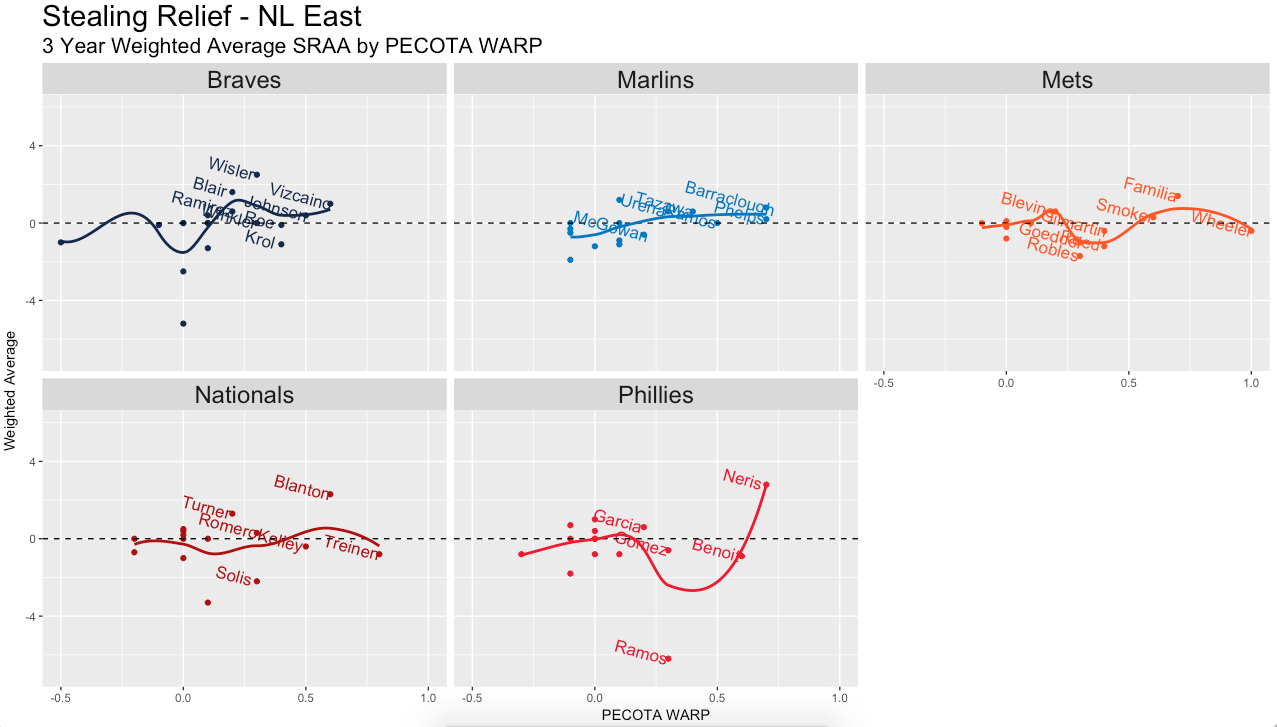
For the NL Central, Blake Wood and Cody Reed of the Reds are the relievers who stand out the most, but since they’re on the Reds it’s probably not that pertinent to the Cubs (although if they keep up .750 winning percentage I will be forced to eat my words). Once you leave the NL Central however, nearly every potential contender for an NL playoff spot (i.e. Mets, Dodgers, Giants, Diamondbacks, Nationals, Rockies) has at least one reliever that they are projected to use in high leverage situations who is below average at controlling the running game. Now this certainly isn’t the only method the Cubs can use to get past these teams; after all Joe Blanton shows up as a reliever who struggles to control the running game, but the Cubs didn’t need to steal any bases off of Blanton to generate runs last postseason. Still it’s nice to know, especially if the Cubs continue to play in one run games (they’ve had four one run games in their first six games), which weaknesses certain relief pitchers have. Now to the second question, if the Cubs are going to engage in some high leverage base stealing, who’s the best player to do it?
To try and figure this out I examined the win probability added for each base running event (for the purposes of this analysis I’ve defined a base running event as either a stolen base, caught stealing, or pick off plays for a season) that occurred from the 2012 major league regular season through the 2016 major league regular season. All successful stolen base attempts were regarded as positive, all caught stealing and pick offs were regarded as negative, but through WPA there was extra credit/demerit given based on the how important these actions were at the time they were taken. For each position player currently on the Cubs 2017 twenty five man roster I converted the results into a set of z-scores (a metric that considers how many standard deviations from the mean a player’s score was – zero is average) and ranked the top ten season by base running z-score below.
| Year | Player | Player Average Base Running WPA | Base Running Events | MLB Mean Base Running WPA | MLB Standard Deviation WPA | Player Base Running Z-Score |
| 2015 | Anthony Rizzo | 0.015 | 20 | -0.002 | 0.039 | 0.420 |
| 2015 | Jason Heyward | 0.014 | 25 | -0.002 | 0.039 | 0.400 |
| 2014 | Javier Baez | 0.015 | 5 | 0.001 | 0.039 | 0.349 |
| 2012 | Jason Heyward | 0.012 | 29 | 0.001 | 0.038 | 0.281 |
| 2014 | Jason Heyward | 0.012 | 24 | 0.001 | 0.039 | 0.263 |
| 2013 | Jon Jay | 0.010 | 16 | 0.001 | 0.039 | 0.247 |
| 2013 | Ben Zobrist | 0.010 | 14 | 0.001 | 0.039 | 0.241 |
| 2016 | Addison Russell | 0.005 | 6 | 0.000 | 0.037 | 0.135 |
| 2015 | Kyle Schwarber | 0.002 | 6 | -0.002 | 0.039 | 0.101 |
| 2014 | Ben Zobrist | 0.004 | 12 | 0.001 | 0.039 | 0.080 |
There’s a couple of caveats to using base running z-scores for the 2017 Cubs, one is the fact that they are overall such a young team they simply haven’t attempted a lot of stolen bases at the major league level. You could argue that this youth and athleticism would lend itself to above average base stealing skills in high leverage situations, but there’s currently not enough data to absolutely confirm this. The other caveat is that high leverage base stealing overtime can sometimes vary; for example Anthony Rizzo’s 2015 base running z-score is so high because he successfully stole six bases out of seven attempts after the seventh inning (including this classic), but in 2016 Rizzo didn’t even attempt a stolen base in the seventh inning or later. Jason Heyward, on the other hand, has been remarkably successful at high leverage base running throughout his career. From 2012-2016 Heyward had a seventy seven percent stolen base success rate on twenty six attempts that occurred in the seventh inning or later. Despite his abysmal offensive season in 2016, Cub fans got a glimpse of Jason Heyward’s high leverage base running skills in the playoffs. This is just another reason to hope that Jason Heyward’s positive results from the young season continue. It will also be interesting to see which, if any, young Cubs player (i.e. Baez or Russell) may try to take the next step forward on the base paths.
Now to be clear I’m not just advocating high leverage stolen bases because I want to return to the days of Lou Brock and Maury Willis. I understand the argument against stolen bases and know about run expectancy tables. But even in this analytically inclined era of baseball, competitive advantages can sometimes be found in an old idea instead of a new one. It will be interesting to see if teams try to push the envelope on the base paths against a relief ace like Kenley Jansen like Jon Jay did when he stole third base last Monday night against the Dodgers. Either way I hope Anthony Rizzo has more magic in store for us this year.
Lead photo courtesy Dennis Wierzbicki—USA Today Sports