Before the spring exhibition season began, we looked at Kris Bryant’s desire to take the ball to the opposite field with more frequency. Having already turned in historically good rookie and sophomore campaigns, it seemed there were few adjustments left that he could make in order to become an offensive force out of the third base position for the Chicago Cubs. As it turns out, in addition to those increased efforts to get the ball to the opposite field, there were a few other improvements that could make him more of a threat at the plate.
Bryant’s output has been one of the steadier sources for a Cubs offense that has sputtered at times throughout what has been a largely disappointing 2017 campaign. After a rough start to the year, he’s turning in a slash that features a .276 average and .394 on-base percentage. His TAv, while down, is still strong at .322, and he’s featured an isolated power figure that is almost identical to his mark from last year, at .264.
There are a few improvements that have been made that have allowed Kris Bryant to remain an offensive force in the wake of some mighty struggles from those around him, but let’s first examine the opposite field element of all of this. In a general sense, that serving as a focal point appears to have paid off. He is taking the ball to the opposite field with more regularity. FanGraphs has his Pull% dropping from 46.7 to 40.3, while the Oppo% has risen from just 19.7 to 26.1. Those percentages appear to fall in line with exactly what Bryant was trying to accomplish coming into the year, and his swing rates in different parts of the zone appear to support those efforts.
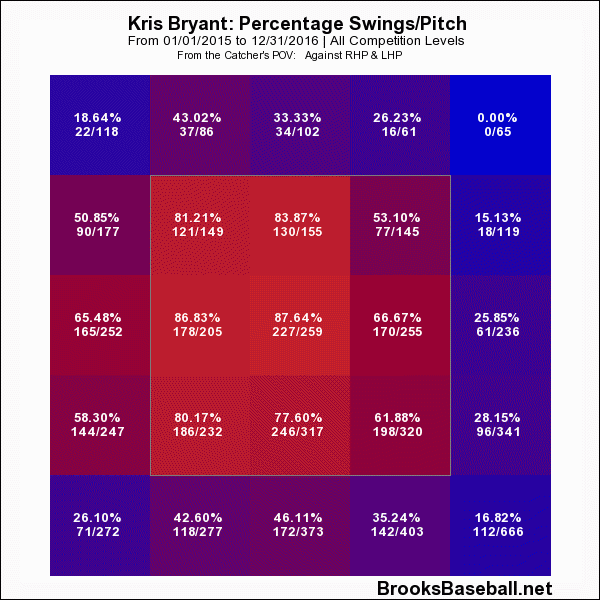
While no change is absolutely drastic, the Swing% on the following heatmaps are indicative of a player trying to get the ball to a certain area. Here’s Bryant’s 2015 & 2016 seasons:
Against his 2017 to this point:
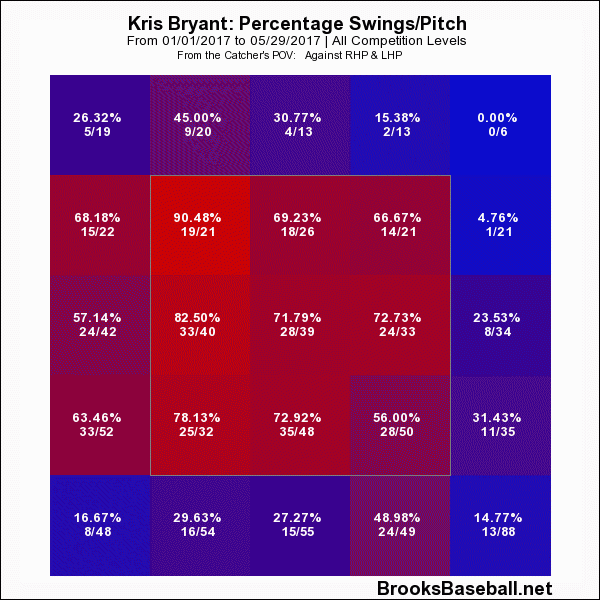
Again, nothing here is totally dramatic regarding those swing percentages, and there’s the sample size element to consider, but Bryant’s clearly making an effort to take some of those outside pitches and move them to the opposite field. His spray chart, this one courtesy of FanGraphs, also reflects some of that:
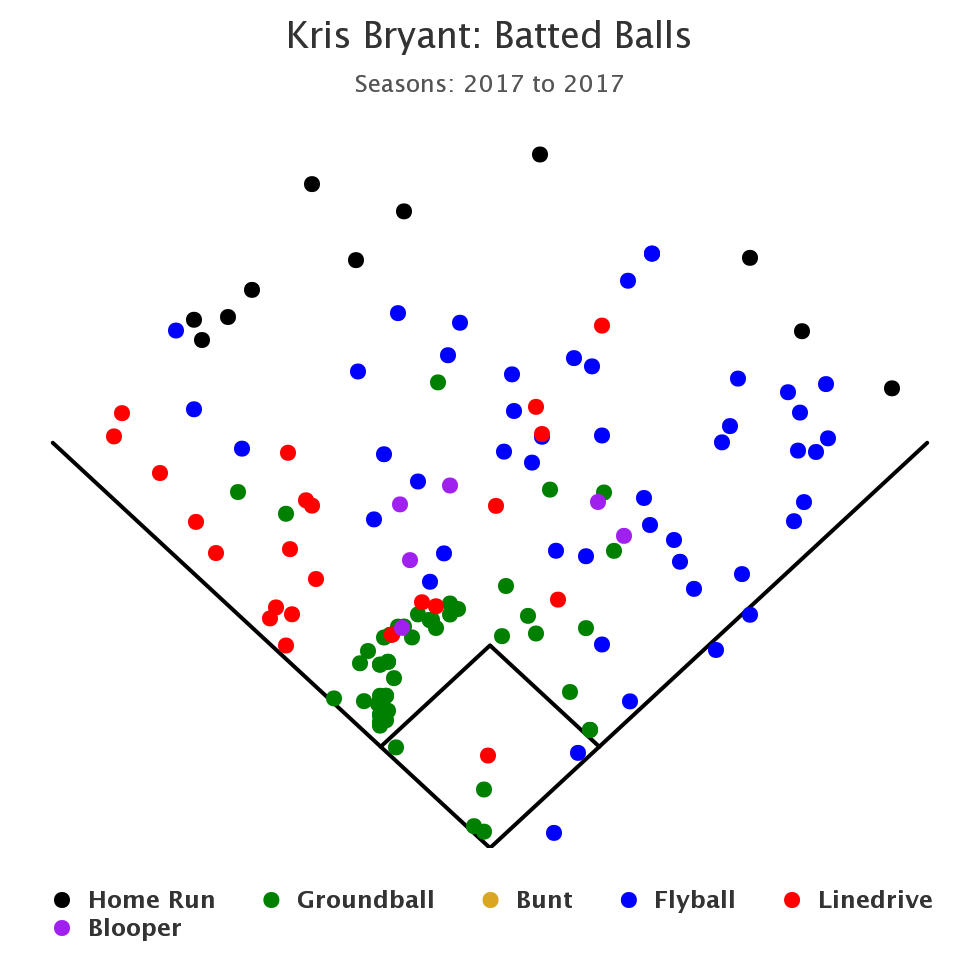
Perhaps nothing is more indicative of that change in approach than the fact that Bryant has already hit three home runs to the opposite field in 2017, which is something he did four times combined across the 2015 and 2016 seasons. It’s not like it’s any surprise that he’s demonstrating power to the opposite field, but the concerted efforts to get the ball in that direct are definitely manifesting themselves in the ISO game.
While it certainly is a pleasure to see Bryant following through on a noted adjustment that he wanted to make, it’s not the only one that has him continuing to improve as this 2017 campaign wears on. There are also some subtle changes in the approach that are paying off as well:
| P/PA | Z-Swing% | O-Swing% | Swing% | Contact% | SwStr% | |
|---|---|---|---|---|---|---|
| 2015 | 4.08 | 73.4 | 28.4 | 48.9 | 64.4 | 16.5 |
| 2016 | 3.86 | 72.9 | 29.0 | 48.8 | 71.9 | 13.0 |
| 2017 | 4.01 | 71.4 | 25.7 | 46.9 | 77.7 | 9.9 |
There are a couple of things here that are particularly encouraging. For one, his swing rate has continued to go down. His patience has always been evident, as illustrated by his pitches per plate appearance numbers that have always been relatively high. But the swing figures indicate that there’s a recognition factor here as well. The swing percentages alone tend to indicate a positive element of Bryant’s game at the plate. But the rest of the story lies in those other elements.
Much was made about Bryant’s improved Contact% after his first season, and that just continues to improve into this season. That patience and pitch recognition continue to evolve the longer that Bryant is at the Major League level. That, in conjunction with a continually decreasing whiff rate, is perhaps more encouraging than anything else here. Maybe even more so than the opposite field element. A player that possesses that much power is already a terrifying element, but you add that pitch recognition that has so notably contributed to increased contact and decreased whiffs in such a short time and you have an absolute terror at the plate. The oppo factor is almost just a bonus at this point.
There’s one additional aspect to consider here in relation to the type of contact that Bryant has made throughout these first two months of 2017. His 29.9 Hard% is the lowest of his career to this point, following years where that figure stood at 37.5 and 40.3. His average exit velocity, according to Baseball Savant, is down from about 89 MPH in 2016 to 85.8 MPH on average in 2017. Given the improvements almost entirely across the board, and the fact that his GB/LD/FB distribution hasn’t ultimately changed that much, it’s an interesting trend. At the same time, it may not be one that’s entirely concerning either.
Given that his Soft% is 16.4, which actually represents a decrease from last year’s figure, it’s hard to get too concerned about it. There are too many other positive elements of his game showing marked improvement to actually worry about that. Consider the adjustments that he was attempting to make on the oppo side, as well as the start he got off to, and it’s possible that his timing may have been thrown off there just a touch.
But given the overall output and the continual improvement demonstrated in his approach and subsequent contact, it’s difficult to worry about Kris Bryant in any capacity. Worry about other parts of this Cubs offense, but not him. The fact that he had an adjustment that he notably wanted to make and has completely followed through with it, while not only not coming up short in other elements, but improving those as well, is simply an astounding idea that really makes you wonder just how high Kris Bryant’s game can go.
**Additional Statistics via FanGraphs
Lead photo courtesy Jake Roth—USA Today Sports