Every Sunday morning from 9AM to the start of the Sunday day game the Cubs flagship radio station (670 the Score) airs a baseball show called Hit & Run. Hosted by longtime Daily Herald columnist Barry Rozner and Score producer/host Joe Ostrowski, Hit & Run serves as break from football talk this time of year when both teams are bad (without the Cubs this year the Mitch Trubisky/Super Bears Super Bowel hype train would be in full swing), and a good synopsis of what is going on with each team when the Cubs and/or Sox are good. This past Sunday Hit & Run the hosts discussed Addison Russell’s defense thus far and were shocked to learn that Russell ranked (at that time) second in all of baseball in Defensive Runs Saved (DRS). You can listen to it here, but the following two tweets sum up the conversation pretty well.
Addison Russell ranks second in baseball with 12 defensive runs saved, per @JoeO670. Just a bit odd. #Cubs
— Hit and Run (@HitAndRun670) June 11, 2017
.@BarryRozner reacting to Russell's defensive numbers. #Cubs pic.twitter.com/6sRHbNYat6
— Hit and Run (@HitAndRun670) June 11, 2017
Needless to say the hosts disagreed with Russell’s nearly league leading DRS figure and contemplated who to call to explain Russell’s DRS metric with Rozner going so far as to hyperbolically (but not really since it’s sports radio and everything’s hyperbolic) ask “Does anyone watch these games?” This got me thinking about advanced defense metrics, specifically how they can be misunderstood without certain caveats. Since I watch games, and you, the reader of BP Wrigleyville, certainly watch games, I figured I could find some happy medium with Addison Russell’s elite DRS numbers by reexamining advanced defensive metrics one more time.
What Are Advanced Defensive Metrics?
Advanced defensive metrics are designed to be an improvement over fielding percentage (which places too much of an emphasis on errors) and errors (which are subjective and penalize fielders who have range). The goal of every advanced defensive metric is to keep a running total of every play a defender makes while allocating points for plays made that were inherently more difficult, and deducting points for plays not made that usually are turned into outs. With that in mind, let’s take a look at the three most prominent individual advanced defensive metrics.
- Defensive Runs Saved (DRS): A statistic that is designed to measure how much above or below average a defender is in terms of runs saved—zero is average, negative is below average, positive is above average. DRS is calculated using Sports Info Solutions (SIS) data, which like PitchF/x, is an entity that is independent of major league baseball. Under the method DRS is currently calculated, each fielding position is compared to itself, therefore the major league leader in DRS may be the best fielder at his individual position, but not necessarily the best overall fielder in the major leagues. There are different components that go into DRS depending on the position (which you can read about here). However, the main component of DRS is the existing range and
positioning input (formerly known as the plus/minus system), which credits or debits fielders relative to how often similar plays had been made in recent seasons. This is done by stringers that SIS hires; SIS divides the field into individual quadrants, and for each ball put in play, stringers consider the batted ball type (ground ball or air ball), batted ball velocity, distance batted ball is from fielder, and the batter’s speed. Once the stringer enters these inputs, the SIS system then compares it to similarly batted balls in the season to see how likely it is that the play is made, and then a final verdict is issued. Finally, DRS now also accounts for the initial position of the defenders per this PowerPoint presentation made by SIS employee Scott Spratt at the 2016 SABR conference. - Ultimate Zone Rating (UZR): There are a lot of similarities between DRS and UZR, including that like DRS, UZR is based off of SIS data and judges fielders on a rolling basis of positive credits or negative debits. Additionally, similar to DRS zero is exactly average for UZR, negative is below average, and positive is above average. The differences between DRS and UZR can be found here – UZR uses fewer quadrants than DRS, and uses multi-year samples instead of current year samples to determine the probability of a play being made.
Since DRS and UZR are so similar they share much of the same weaknesses: namely there are inherent biases for the stringer entering the data (i.e. hard contact could be medium contact to some) which may cause some categorizations to vary from individual stringer to individual stringer. The final advanced defensive metric tries to protect against this bias.
- Fielding Runs Above Average (FRAA): FRAA is Baseball Prospectus’ individual defensive metric. Unlike DRS and UZR, FRAA doesn’t divide the field up into additional zones/quadrants. Instead, FRAA uses play by play data, and focuses in on the expected numbers of plays per position, the handedness of the batter, the park, base-out states, and a pitchers historical tendencies (i.e. ground ball pitchers vs. fly ball pitchers).
While DRS, UZR, and FRAA are all improvements over fielding percentage and errors, they each share the same flaw in that that are extremely susceptible to sample size. As a hitter, you’re guaranteed roughly four trips to the plate each night that can be used to judge your batting talent, but as a fielder there’s no guarantee that there is going to be even one time each night where one could separate oneself from the pack and show his true fielding talent. These fluctuations in defensive metrics caused by small sample sizes are evident when comparing the three defensive metrics (FRAA, UZR, DRS) to each other. Below, I’ve posted pairwise correlation matrices that include all qualified fielders from the preceding five-year period (2012-2016), and qualified fielders for 2017 thus far.
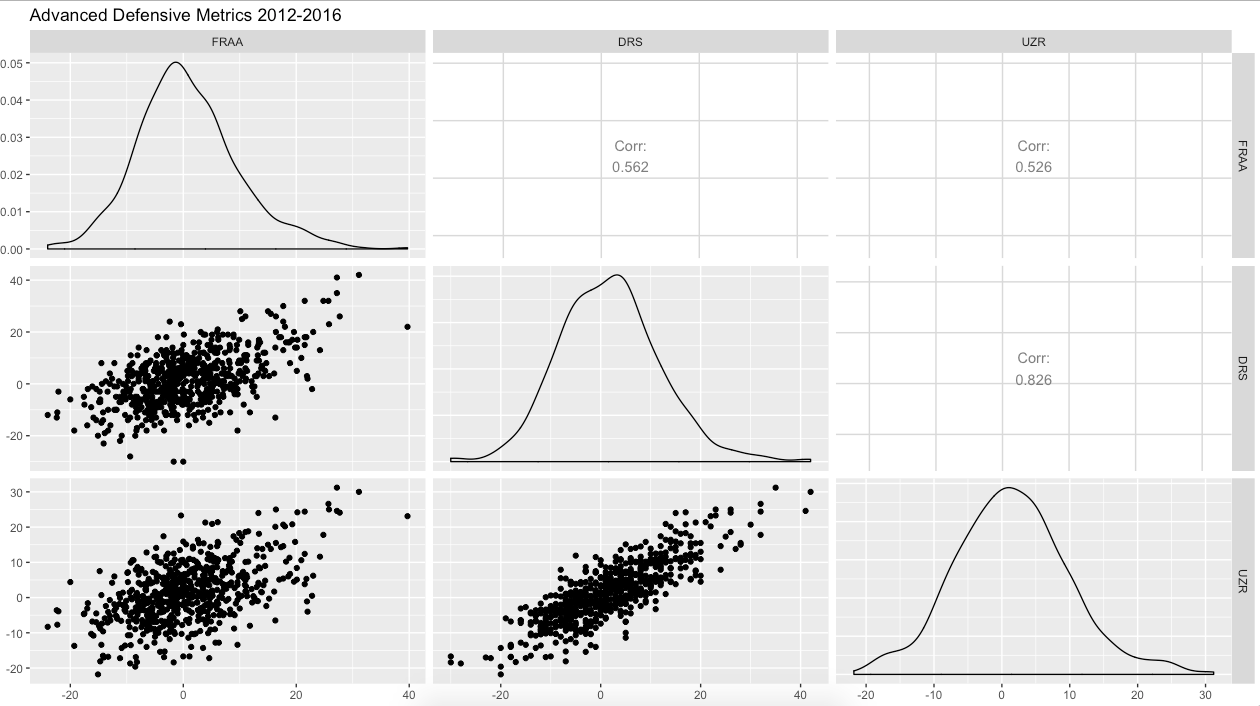
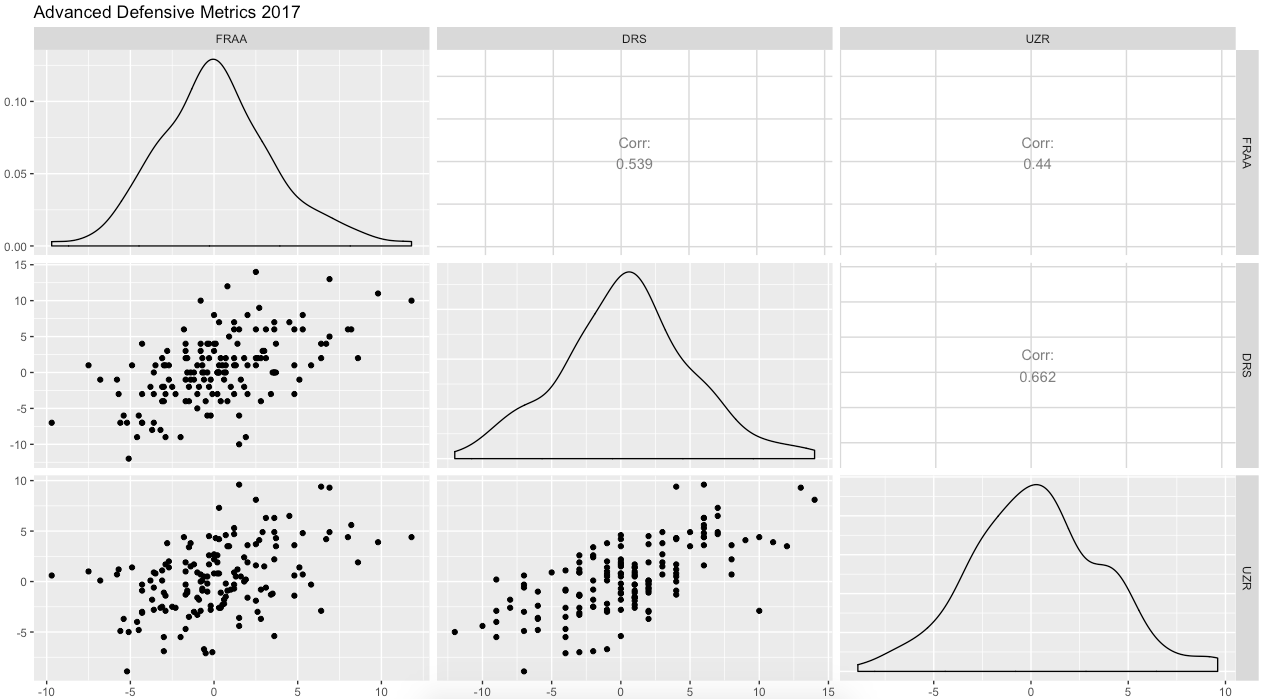
The correlation figures showing the strength in relationship between each of the three metrics decreases in 2017, when we have only a third of a season of data, compared to the 2012-2016 figures.
So how does this relate to Addison Russell? I actually agree with Rozner and Ostrowski that Russell has not looked anywhere near as good as he did last year, and there have been issues with Russell’s throws, whether because of a lingering shoulder injury, or something else only Russell knows. But when it comes to DRS and the other defensive metrics discussed above, aesthetically pleasing or not, if the fielder converts the batted ball into an out he gets the credit. This pertains to Russell specifically, because while the arm strength and accuracy hasn’t always been there, as you can see from the highlights below his range is still phenomenal.
I can’t say for sure because I’m not privy to the SIS data used to calculate DRS, but the catch along the left field line in San Diego, along with the plays that Russell made on Yangervis Solarte and Joey Votto that required him to go the right field side of second base had to have a low probability of the shortstop converting the out on those specific batted balls. And this is perhaps the curse of knowing a team as intimately as Cub fans and beat writers do. By comparing the fielding of Addison Russell or Javier Baez in 2017 to their 2016 versions and pointing out flaws, we neglect to compare these players to the overall fielding of their peers at their respective positions, where they still rank very highly.
DRS tries to accomplish this and usually does a good job, but like I said above it, like other defensive metrics, is susceptible to small sample size, so if Addison Russell really has declined in the field from last year the numbers should bare themselves out as the year goes along. For the record, while DRS has Addison Russell ranked third overall, FRAA has him ranked 64th overall, and UZR has him ranked 32nd overall, so there’s some disagreement about Russell’s performance in the field thus in the 2017 season. These differences will probably become a moot point in the next five to ten years as the Statcast catch probability system is introduced to the infield and (hopefully) allows analysts to have a true, quantifiable standard bearer for what is a great defensive play versus what is not. But, even then, you should still watch the games.
Lead photo courtesy David Banks—USA Today Sports