The ultimate match-up in baseball is the confrontation between the pitcher and the batter. And more than anywhere else, that battle is waged in and around the corners of the strike zone. Mindful of this, Cubs President Theo Epstein has preached that his team must “control the strike zone” in order to be successful ever since his arrival in 2011. At no time was this more evident than in 2016, as the Cubs patiently wore down opposing starting pitchers, grinding out at-bats and punishing mistakes on their way to scoring 808 runs, finishing behind only the Rockies in the National League.
In 2017, the Cubs once again finished second in the NL in runs scored, and actually scored 14 more runs than in 2016. However, for long stretches of the season, it certainly felt like the team was struggling to put together quality at-bats and was having real difficulty pushing across runs. Jed Hoyer recently admitted as much in a radio interview last Friday, stating “It didn’t feel like our at-bats were quite as difficult last year as they were in 2016…In 2016, I feel like we were an exhausting offense to pitch against…it didn’t feel like we were as challenging to pitch against in 2017.”
I doubt that too many Cubs fans would disagree. But is there any way that we can quantify that?
One method recently proposed by MLBAM’s Tom Tango, and the one that we will adopt here, involves crediting (or debiting) the hitter for the count that each of his plate appearances eventually ends on. Intuitively, we know that hitters tend to perform worse once they are behind in the count, and better when they are ahead. A hitter who finds himself consistently down 0-2 before either putting the ball in play or striking out is a lot less likely to provide value than one who consistently works himself into favorable counts. However, we can actually quantify this effect if we know the expected value gained or lost when a hitter works himself into a particular count. Fortunately, this can be calculated.
To calculate the expected run value for each count, we look at each plate appearance across the league over the course of a season and consider all of the counts that the plate appearance went through, as well as the outcome. Using the concept of linear weights, each outcome (single, strikeout, etc.) is assigned a certain expected run value (For a full primer on linear weights, see this article). The expected run value of a given count is simply the average of the linear weights for all plate appearances that go through that count. Shown below is the expected run value for each count for the 2017 season, courtesy of Tango.
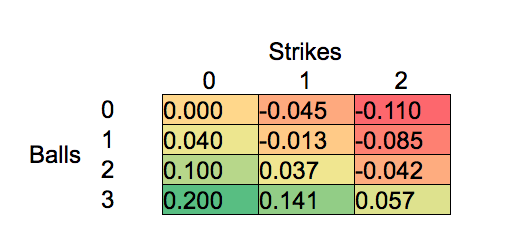
We can see that the above chart tells us a lot that we already know – 2-0, 3-0 and 3-1 are especially good hitter’s counts, and 0-2 and 1-2 are favorable to pitchers. However, now we have an actual number that can quantify exactly how good or bad a count is, in terms of runs. And while the number in the chart may not seem like much, over the course of hundreds of plate appearances these small advantages (or disadvantages) can add up to a significant number. We see this effect when it comes to catcher framing, as well.
In this study, we will calculate an expected run value for a batter or a team by considering the count that each of their plate appearances ends on, and summing up the expected run values corresponding to each count. For example, if a hitter has a game with five plate appearances, two of which end on a 1-2 count and three of which end on a 2-0 count, his run value “produced” by working the count would be 2*(-0.085) + 3*(0.100) = 0.13 runs.
Of course, the hitter needs to execute when the count is in his favor in order for the advantage to ultimately mean anything on the scoreboard, which is why I added quotation marks to the word produced. It is possible that our hypothetical hitter could have launched a home run on one of his 1-2 counts, and popped up on a 2-0 count. However, for this study, we are concerned with measuring how well a hitter controls the strike zone by working himself into good counts, and not how productive he is once he is there (which is likely a separate skill entirely). Thus, we will limit ourselves to considering the run value “produced” only by working the count.
In order to evaluate how well Cubs hitters have satisfied Epstein and Hoyer’s desire to control the strike zone, I calculated the total run value “produced” by working the count for each team over the last two seasons, relative to a league average team. Results are presented in the tables below.
| 2016 Team Leaders | ||
| Rank | Team | Runs Above Average |
| 1 | Toronto | 27.6 |
| 2 | Chicago Cubs | 18.3 |
| 3 | Houston | 17.2 |
| 4 | San Francisco | 12.9 |
| 5 | Washington | 12.0 |
| 6 | LA Dodgers | 10.5 |
| 7 | NY Mets | 9.8 |
| 2017 Team Leaders | ||
| Rank | Team | Runs Above Average |
| 1 | Cleveland | 39.0 |
| 2 | LA Dodgers | 30.7 |
| 3 | Houston | 27.3 |
| 4 | NY Yankees | 20.2 |
| 5 | St. Louis | 15.0 |
| 6 | Minnesota | 15.0 |
| 7 | Washington | 11.7 |
| 20 | Chicago Cubs | -6.8 |
Confirming our suspicions, the Cubs truly did control the strike zone at an elite level in 2016, finishing second in baseball behind only the Blue Jays. Further, when looking at the 2017 standings, we see a major drop off – the Cubs “produced” roughly 25 fewer runs from controlling the strike zone this past season as compared to 2016, finishing in the bottom third in baseball. Other than the one-and-done Rockies, the Cubs were the lowest-ranked postseason team in this category in 2017. So Jed Hoyer’s feeling that the Cubs didn’t produce as many difficult at-bats in 2017 is correct – and now we have some data to back it up.
Naturally, the next question would be to figure out what would cause such a steep decline. So, I went back and calculated the run value “produced” by working the count for each Cub over the last two seasons, relative to a league average player with the same number of plate appearances.
| 2016 Cubs Leaders | ||
| Player | PA | Runs Above Average |
| Dexter Fowler | 551 | 9.47 |
| Ben Zobrist | 631 | 9.34 |
| Jason Heyward | 592 | 3.77 |
| Kris Bryant | 699 | 3.37 |
| Chris Coghlan | 300 | 2.8 |
| Miguel Montero | 284 | 2.26 |
| Anthony Rizzo | 676 | 1.74 |
| Willson Contreras | 283 | -0.47 |
| Addison Russell | 598 | -0.78 |
| Javier Baez | 450 | -3.94 |
| Minimum 250 PA | ||
| 2017 Cubs Leaders | ||
| Player | PA | Runs Above Average |
| Kris Bryant | 665 | 7.94 |
| Jason Heyward | 481 | 4.82 |
| Ben Zobrist | 496 | 3.58 |
| Kyle Schwarber | 486 | 2.5 |
| Anthony Rizzo | 691 | 1.59 |
| Ian Happ | 428 | 1.01 |
| Willson Contreras | 428 | -1.56 |
| Addison Russell | 413 | -1.77 |
| Albert Almora Jr | 385 | -3.32 |
| Jon Jay | 433 | -4.57 |
| Javier Baez | 508 | -5.89 |
| Minimum 250 PA | ||
Immediately, we can see the impact that the loss of Dexter Fowler had on the Cubs’ lineup. Fowler was excellent at controlling the strike zone in 2016 from the leadoff spot, working deep counts and setting the table for the run producers coming up behind him. In his place, the Cubs divvied up most of their center field at-bats in 2017 between Ian Happ, Albert Almora, and Jon Jay. The trio combined to provide adequate production on the whole, but really struggled to provide the type of grinding, difficult at-bats that Fowler did the year before. With the plan for center field in 2018 still unsettled, this could be another weak spot in the Cubs quest to regain control of the strike zone, absent another roster addition.
Looking at the rest of the 2017 leaderboard, the names at the top and the bottom should come as little surprise. Kris Bryant has seen his walk rate increase and strikeout rate decrease each season of his career, and his evolving mastery of the strike zone is reflected in these numbers. Perhaps least surprisingly, Javier Baez was the worst Cubs hitter in terms of strike zone control in 2017 (and 2016, as well), and his continued presence in the lineup, along with the situation in center field, may limit the ability of the Cubs as a team to provide difficult at-bats up and down the lineup.
Right below Bryant at the top of the leaderboard, however, some might be surprised to see Jason Heyward and Ben Zobrist. Both veterans went through some well-documented struggles, whether due to a nagging injury (Zobrist) or continued mechanical issues (Heyward). However, these numbers might provide reason for cautious optimism. Despite each player’s lack of total production, we can see that each still possesses the ability the control the zone and get themselves in a position to get a pitch to drive. The key to a better 2018 for each will be taking advantage of those hitter’s counts when they get the opportunity. If one or both is able to do so, it could add another dimension to the Cubs’ offense and provide a source of unexpected production.
Lead photo courtesy Geoff Burke—USA Today Sports