
Photo courtesy of David Kohl-USA TODAY Sports
Looking around the diamond these days, Cubs fans can be forgiven for feeling a little bit smug. Ensconced at six of the eight non-pitching positions are players who have either been an All-Star (Anthony Rizzo, Starlin Castro, and Miguel Montero) or been a BP Top Twenty prospect (Kris Bryant, Addison Russell, and Jorge Soler) in the last twelve months. The two exceptions are center field—Dexter Fowler, for all his many virtues, was last a Top Twenty prospect in 2009—and left field, where the Cubs have used a total of five different players, most frequently Chris Coghlan (72 percent of the PAs at that position).
Although the plan going into the season was for Chris Denorfia to start most games against lefties, and Coghlan most games against righties, a nagging injury to Denorfia’s hamstring has limited him to just three starts on the young season, with the remainder taken by Coghlan (nineteen), Matt Szczur, and Junior Lake (one each). Bryant also has a lone plate appearance at the position, in which he singled. Given that a projected platoon has morphed into more of a recurring broadcast of the Chris Coghlan show, I thought it might be worth looking into the Cubs’ left-field production, in general, Coghlan’s individual contribution to that production, and how both might be expected to change over the course of the season.
First, here’s the Cubs’ production from all left fielders this season, with major-league ranks in the second row:
| AVG | OBP | SLG | BB% | K% | ISO | BABIP | LD% | GB% | FB% | wRC+ | UZR/150 | WAR |
| .264 | .322 | .427 | 8.1 | 22.0 | .164 | .321 | 21.4 | 44.8 | 33.8 | 105 | -2.4 | 0.3 |
| 13th | 12th | 12th | 12th | 13th | 13th | 7th | 16th | 17th | 15th | 13th | 19th | 16th |
Scanning along that line, there’s a fair amount to like—or at least to be OK with. The triple-slash line looks like approximately league-average production, perhaps inflated a bit by a high BABIP, and the batted-ball stats look approximately average as well. The defense (at least measured by UZR/150) is a bit shaky, dragging the overall WAR down a little bit, but on the whole this is acceptable production.
Now let’s take a look at what Coghlan, individually, is contributing to the mix. These are his stats as a left fielder this year, compared to the Cubs’ overall production from the position:
| Name | AVG | OBP | SLG | BB% | K% | ISO | BABIP | LD% | GB% | FB% | wRC+ | UZR/150 |
| All LF | .264 | .322 | .427 | 8.1 | 22.0 | .164 | .321 | 21.4 | 44.8 | 33.8 | 105 | -2.4 |
| Coghlan | .200 | .257 | .431 | 7.0 | 21.1 | .231 | .213 | 18.4 | 32.7 | 49.0 | 83 | 13.6 |
Well, that certainly is intriguing. While Coghlan’s walk and strikeout rates are roughly the same as the Cubs’ left-fielders in the aggregate, his average (and correspondingly, his on-base percentage) are much, much lower than the mean. And remember, this is a mean that is composed of nearly three-quarter Chris Coghlan plate appearances, so he’s dragging the overall numbers down towards his quite a bit already.
If you were to point fingers for that low average, you would probably point them at his relatively low BABIP (.213), which would typically be read as indicative of pretty poor luck. Here, though, I’m not so sure that that’s what’s happening. Take a look at the fly-ball percentage in Coghlan’s 2015 line as a left-fielder. At 49 percent, it’s not only nearly 65 percent higher than his career mark of 29.7, it’s absurdly high in general: the ninth highest in the majors this season, for players at any position, and second-highest in the National League behind Jay Bruce.
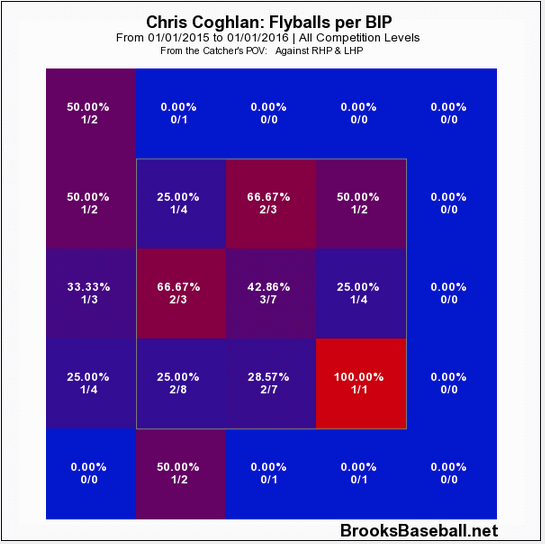
In general, you don’t want to hit fly balls as a batter unless you’re reasonably confident you’re going to hit them out of the ballpark; when they stay in the park, they tend to get caught. But this year, Coghlan is hitting an awful lot of fly balls that haven’t left the park, and it’s hurting his production. And although I am not a scout, nor even a particularly experienced analyst, I noticed something that might indicate that this change in results is the result of a change in approach. Let’s take a look at what kind of pitches (that is, where they are in the strike zone) Chris Coghlan is hitting fly balls off of in 2015:
And here’s the same chart, from last season (when Coghlan’s fly-ball rate was at career-average levels, as was his BABIP):
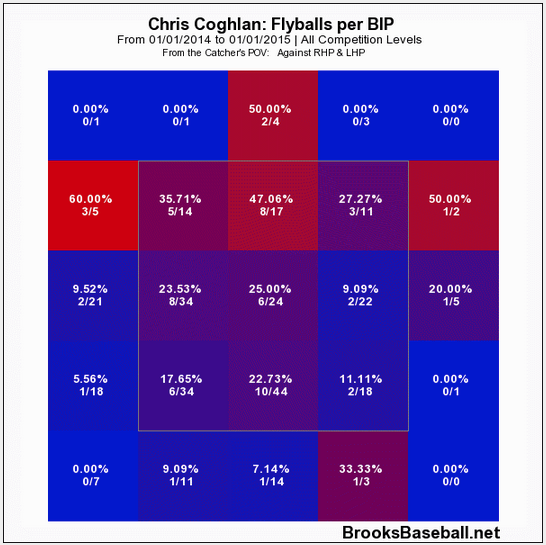
Looking at those two charts, here’s what immediately stands out to me: This season, Coghlan seems to be hitting a lot more fly balls on pitches down in the zone than he did last year (when he seems to have been most likely to hit fly balls on pitches up in the zone). Because I don’t like to rely solely on my eyes, I calculated the percentage of fly balls Coghlan hit on (a) pitches in the middle of the zone and above, and (b) pitches in the middle of the zone and below, for both 2014 and 2015:
| Year | FB/BIP, Middle-Down | FB/BIP, Middle-Up | Ratio, MD : MU |
| 2014 | 16.0 | 25.0 | 64 : 100 |
| 2015 | 34.1 | 41.9 | 81 : 100 |
Ignore, for a moment, the fact that the middle two columns return higher values for 2015 than for 2014—that’s to be expected, given the increased fly-ball tendencies we’re exploring. Focus on the ratio. While Coghlan, in both 2014 and 2015, hit a higher percentage of fly balls on pitches up in the zone than down in the zone, that ratio significantly narrowed this season, increasing approximately 25 percent (from 64 to 81). And the problem with generating fly balls on pitches down in the zone is that, unless you really put a charge into them (and they become home runs), the tendency is to get under them—to the point where they hang up in the air and become easy outs.
If I had to guess at what’s happening with Chris Coghlan’s low BABIP this year, I’d say, first, that I’m not sure that it has to do with a mechanical change, based solely on the evidence above. But second, I’d point you to a piece BP Wrigleyville’s estimable Editor-in-Chief, Sahadev Sharma, wrote last month, wherein he had a chance to ask Coghlan and hitting coach John Mallee about any changes in approach this year. Quoth Mallee:
“[Coghlan] wanted to be able to get more lift on balls down and try to drive the balls there. He’s always handled balls up very well and now he handles the ones that are down too.”
The data I looked at above was circumstantial but hardly probative. Linked with this direct evidence from Mallee that Coghlan had indeed made a change on balls down in the zone, it becomes safer to conclude that Coghlan’s fly-ball percentage and, consequently, his BABIP, have been the result of a mechanical change rather than pure luck. And (here I venture into speculative territory) I’d say that Coghlan’s new willingness to put uppercut swings—the kind that generate fly balls, and sometimes home runs—on pitches down in the zone, is having mixed effects for him this year.
On the one hand, it’s led to quite a few home runs—three so far, already a third of last season’s total—and an ISO of .214 that’s significantly above his career mark of .134. On the other hand, the fly balls down in the zone that he doesn’t quite square up are hanging in the air, and are easy marks for defenders, thus depressing his BABIP and all its attendant statistics. Again, I can’t speculate why Coghlan has tried to make this change, but if I was forced to guess, I’d say that Coghlan is trying to improve his power numbers by generating fly balls on pitches down in the zone, and it’s not quite working.