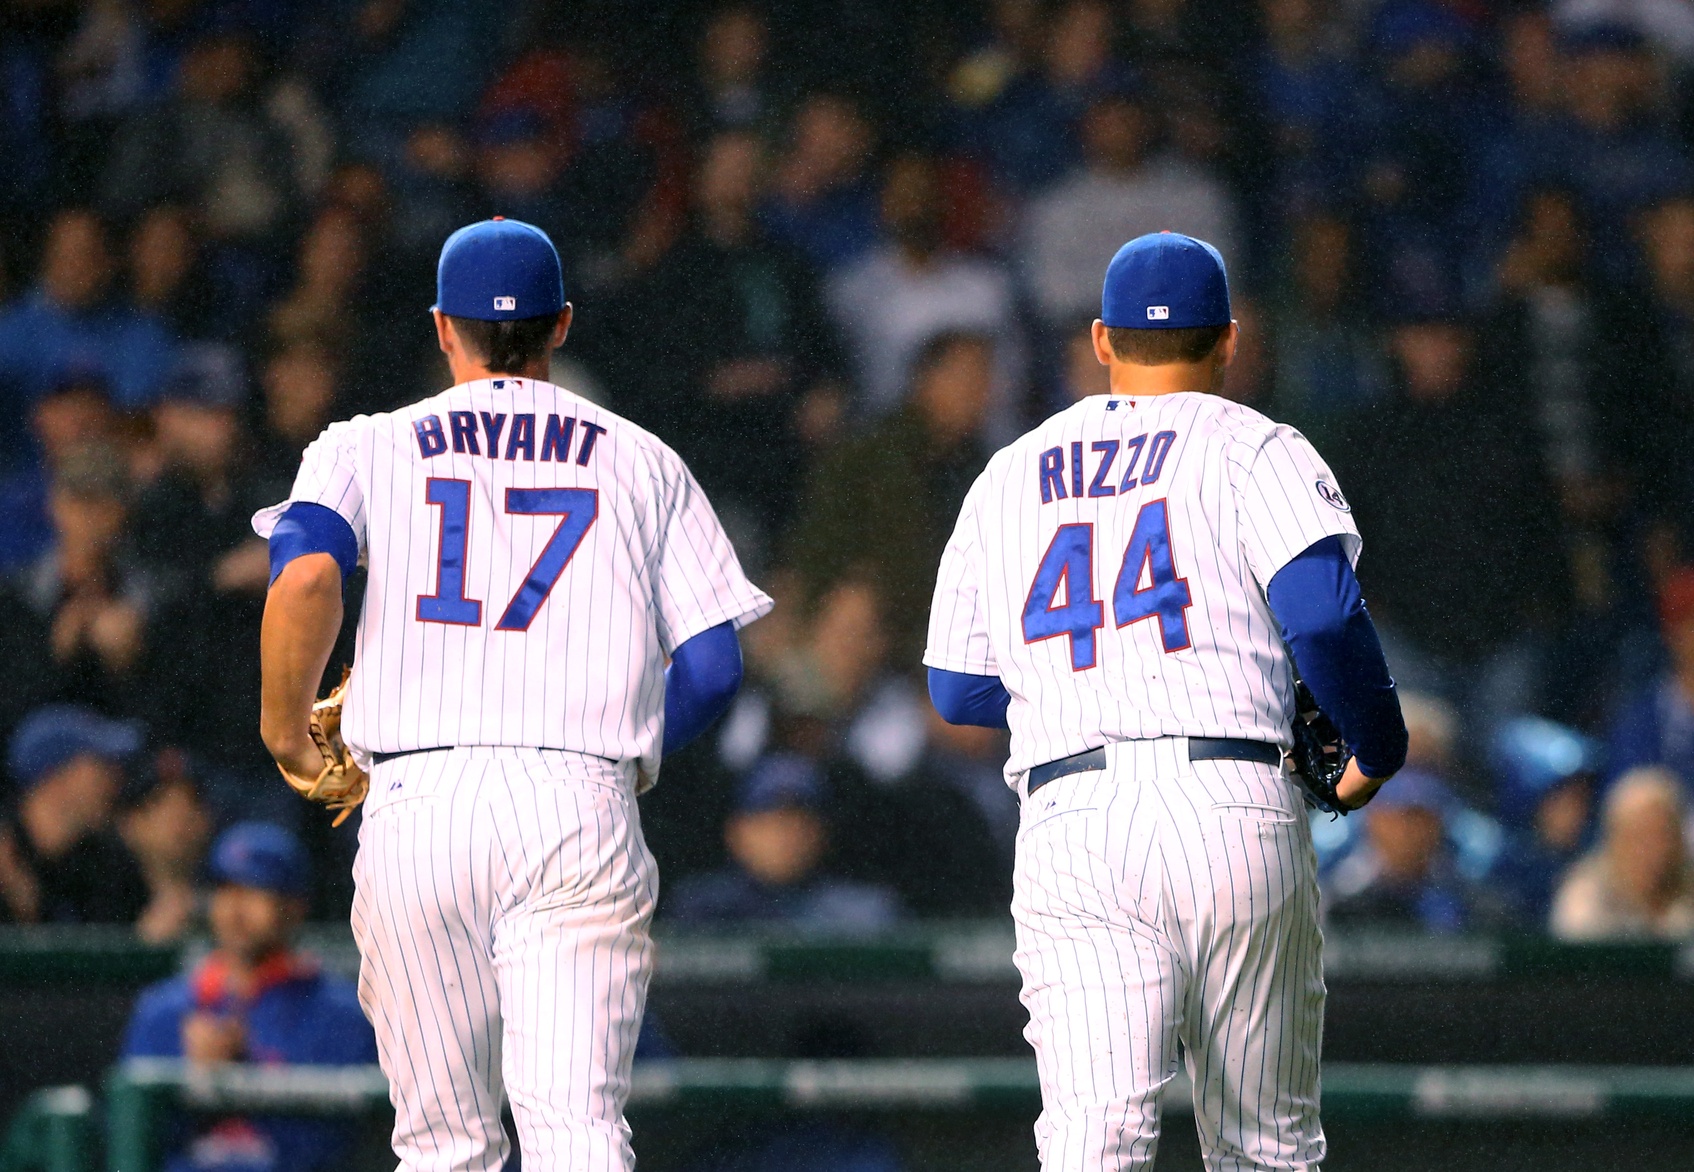
Last week, it was announced that both Anthony Rizzo and Kris Bryant would participate in the Home Run Derby at the All-Star Game, and since they’re both going to be in Cincinnati anyway, why not? Almost immediately, consternation materialized as concerns mounted as to whether there might be deleterious effects by participating. With the explosion of data available, it’s easy enough to check out.
The Home Run Derby began at the All-Star Game in 1985, and has continued every year since except in 1988, when it was rained out. After being indirectly urged to gather the data (go to the 3:44 mark), I went to Baseball-Reference for split data by half for all players who have participated in the Home Run Derby. Since I’m a nice guy, I put it all in a Google Docs spreadsheet for all who want to play around with the data themselves. I also created a Tableau data visualization that shows the winners and contestants by year.
There was an article in the Wall Street Journal last winter that discussed the effects that participating in the NBA All-Star Game Slam Dunk Contest had on players, and it’s logical to think that a similar effect could occur to Bryant and Rizzo. In addition, There was an article published in the Fall 2010 Baseball Research Journal that investigated this issue, but it’s over my head. Generally, it concluded there was a dropoff in performance for players who participated in the Home Run Derby.
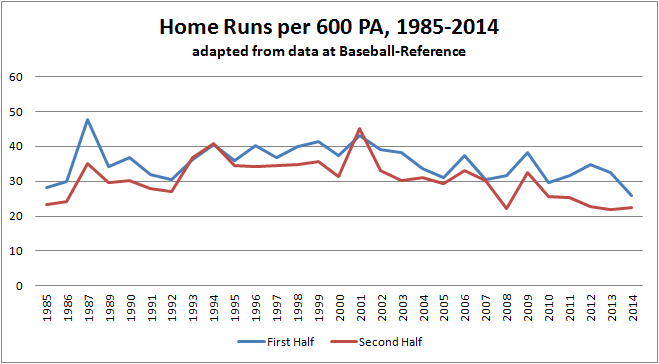
Bryant and Rizzo have said all the right things, likening it to taking additional batting practice, but what does the data show? I’ll use two primary measures to see if there were any changes—the first is home runs per 600 plate appearances, which normalizes home runs to see if there was an increase or decrease by half:
There is a small but persistent decrease in home-run rate in the second half as opposed to the first. Of course, this can be attributed to numerous factors, such as player fatigue, game conditions, quality of opponents and others.
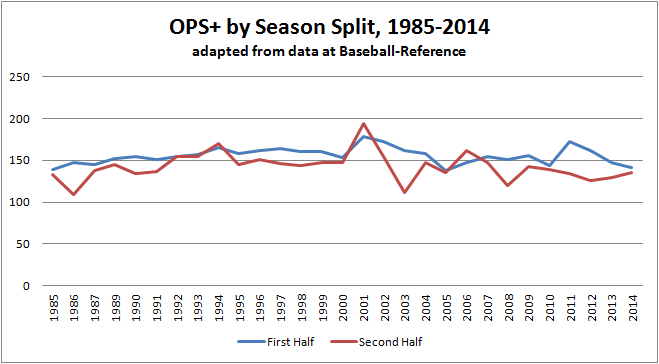
This chart looks at OPS+ to check for differences, since offense is more than just hitting home runs:
The variation is getting smaller.
I haven’t mentioned the patently obvious yet, which is that these are from extremely small sample sizes. In the history of the Home Run Derby, there have been a total of 238 participants through 2014, or an average of around eight participants a year. Given that around 1,000 players are in the big leagues every year, this is far too small a sample with which to draw accurate inferences.
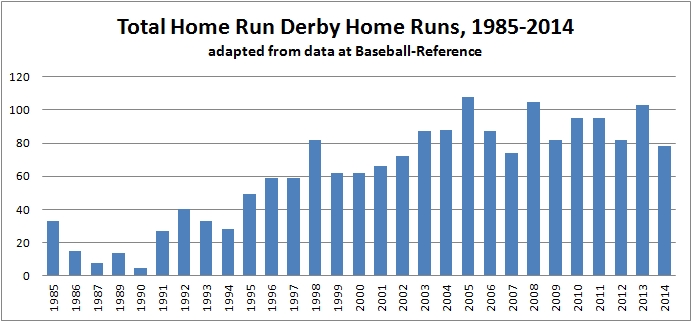
There is one cause for concern—the format for this year’s derby has been changed to one in which the hitter will try to hit as many home runs in five minutes, as opposed to getting the same number of outs as every other contestant. There’s already been a gradual creep in the number of home runs hit, and consequently, total swings as additional rounds have been added:
Every swing, particularly an exaggerated swing to hit the ball 800 feet, creates an opportunity for injury. Couple this with the inclination to take more swings in order to rack up home runs, and it’s easy to see the source of the fear. Of these 238 participants, 152 had a dropoff in OPS+ in the second half compared to the first, or around 64 percent. Players like Barry Bonds or Ken Griffey Jr. who participated in multiple Home Run Derbys were up and down, depending on the year.
Running any statistical test will show there is a decrease in second half performance for players who participated in the Home Run Derby, and those decreases, no matter the measure tested, are statistically significant. There is a world of difference between statistical significance and real world relevance, and chances are that’s what is occurring. It’s beyond my abilities to confidently winnow out every other variable to confidently state it was absolutely participation in the Home Run Derby that caused the second half decreases for these players.
A wealth of data and the computational ability to process that data quickly and easily creates the very real possibility of misinterpretation of the results. When an article in the official research publication of the Society for American Baseball Research (SABR) suggests there is an effect, I have no choice but to consider the possibility, but abstract differences have to be balanced against actual results.
This could be a classic case of confusing correlation with causality—it’s temptingly easy to make the statement “They participated in the Home Run Derby, and their second-half hitting decreased. I told you they shouldn’t have done it!” Unless either Bryant or Rizzo actually pulls a muscle taking a swing, it will be almost impossible to confidently state that participation in the derby would have consequences down the final stretch of this season, but misinterpreting a very small sample size could make it easy to do so. Resist the urge. Trends are trends, but while they’re reflective of the past, they’re not absolutely predictive of the future. Either Bryant and Rizzo will, or they won’t be affected by participating in the Home Run Derby. My money is on the latter.
Lead photo courtesy of Mark J. Rebilas-USA TODAY Sports


Might this small effect be explained by regression to the mean? It seems likely that over-performing batters will be those chosen for the derby.