On Monday, July 21st, the Cubs were facing off against the Cincinnati Reds at the Great American Ballpark. They were 49-42 and only a game ahead of the San Francisco Giants for the second NL wild card spot.
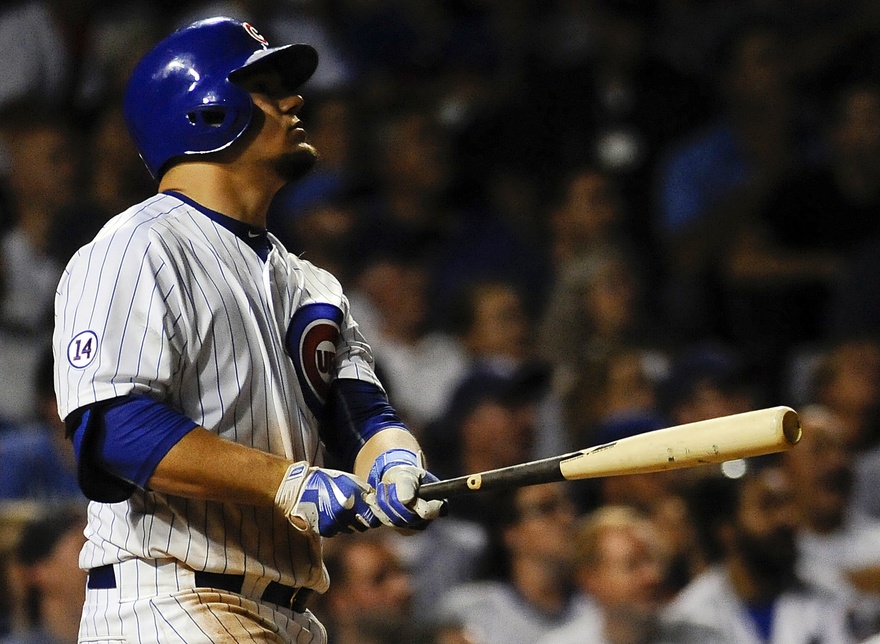
Down by two runs in the top of the ninth with a man on, rookie Kyle Schwarber (who had recently been called up and had only 10 games under his belt) came up to the plate and did this:
There would be free baseball in Cincinnati that night—until Schwarber came up to the plate in the top of the 13th and introduced himself to the entire baseball world:
I’m telling you this story because it perfectly displays many of the things that went the Cubs’ way in 2015. Make no mistake about it: The Cubs won 97 games last year because they had a solid team—but how big of a factor did luck play into those 97 wins and how might that affected the club’s plans this offseason as they prepare for 2016?
Let’s take a closer look at some different “luck stats” and see how the Cubs fared relative to the rest of the league in what was a magical season for the players, the fans, and the adult-onesie conglomerate.
One-Run Games
Rian Watt was already looking at this back in June—and by the time the season ended, the Cubs were one of the best-performing teams in baseball in close games: They finished 34-21 (.618) in one-run games. That’s a fantastic record, but it’s even more incredible when you consider that only the White Sox (59), Mariners (57), and Rays (56) played in more one-run games than the Cubs (55). Those other teams, however, all had records below .500.
You could look at this as a positive and spin it thusly: Wow, this team is really good “in the clutch.” They are young and don’t get phased by “big moments” because they “don’t know any better.” Their pitchers have “ice in their veins.” It’s a nice narrative, but it’s one that doesn’t really hold much weight in the real world.
A team’s fantastic record in one-run games isn’t sustainable. The Cubs had the third-best record in the league and we should expect that to get worse next year. Oh and in case you’re curious about who had the best record in one-run games, it was the Pirates. Keep that in mind as we move along.
Extra-Inning Games
These are kind of like the younger brother to one-run games. Same idea as above: A very good record isn’t something you should expect to see year over year.
The game in which Schwarber hit two home runs to eventually beat the Reds was one of 18 games the Cubs played in extra-innings. Their record in those games was 13-5 (.722)—good for third in baseball. Here again the Cubs were near the top of the list in terms of frequency: Only the White Sox, Mariners, and Pirates played more free baseball (their records were inferior to the Cubs’—although the White Sox did match the Cubs’ record).
Again, extra-inning games are exciting—especially when you manage to pull it out and get the W. But when you see them near the top of both one-run games and extra-inning games played, it makes makes you a little nervous about next year.
Health
Being healthy is one of those things you don’t really notice until the injury bug hits and you’re left scrambling to adjust. Just ask the Cardinals—they were completely decimated by injuries last year. The Cubs? Not so much. Sure, Tommy LaStella, Jorge Soler, Miguel Montero, and Neil Ramirez all missed some time here and there—but it was nothing like what the Cardinals faced.
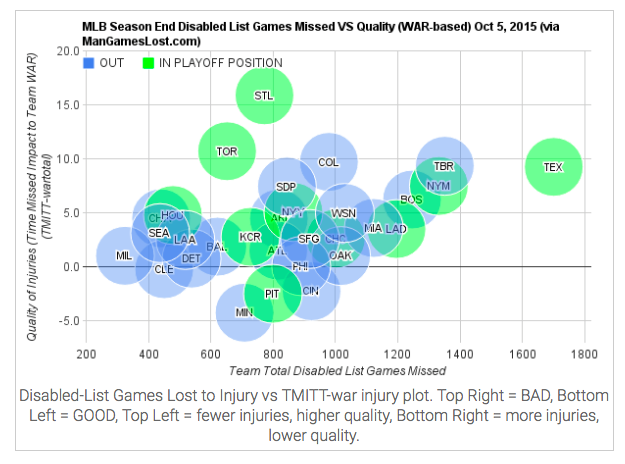
Check out the chart below from Mangameslost.com. It not only shows how many games each team lost to the disabled list, but the overall impact of WAR that those injuries had. If you lose a Manny Alexander type guy for the whole season, it matters less than if you lost Anthony Rizzo for a couple weeks.
You want to be near the bottom of the chart. Ideally on the left half, which would mean you didn’t have many guys missing time—but that’s less important than Y axis. See the Cardinals? They were extremely unlucky when it comes to injuries, which is a scary thing to consider since they still wound up winning 100 games and taking the NL Central.
The Cubs are hard to spot, but they’re between the Nationals and the A’s over by the 1000 games missed mark. The WAR impact for them is around two, so they did pretty well in this department. That number, however, doesn’t tell you the whole picture, because the biggest chunk of WAR they lost was from Mike Olt’s time on the DL (2.21 WAR). The other players who missed time had a much smaller impact on the “lost WAR:” LaStella (0.35), Ramirez (0.34), Montero (0.27), and so on.
So the only reason the Cubs aren’t down near the zero line on the X axis (luckier) is because Olt got hurt. Thanks to Olt’s injury, however, the Cubs called up Kris Bryant, who was one of their best players.
How very fortunate of them.
Rookie Production
I talked about this in my piece on trading Jorge Soler, so I won’t rehash the whole thing here. In short, the Cubs enjoyed a historic performance from their rookies in 2015. They called up Bryant, Schwarber, and Addison Russell—and all of them were fantastic in one way or another.
The Cubs don’t need to call up more rookies next year to break out and contribute heavily to the team, but it’s still worth noting that one or more of these guys may regress from the sterling debuts they had in 2015.
You could make the case that this has nothing to do with luck, but when you go three for three and get the results the Cubs got from those guys, it’s hard not to feel like things went your way.
Cluster Luck
When I mentioned that the Cardinals had terrible luck with injuries, Cubs fans probably felt a heavy dose of dread. If they had terrible luck (and we would expect them not to be as unlucky next year), then how on earth did they win so many games?
Ben Lindbergh shed some light in his piece on cluster luck over at Grantland (RIP). Cluster luck tries to measure how lucky a team was by taking context out of the equation. If a guy pitches one inning and allows a walk, a single, and a then home run, then that’s a pretty bad inning, right? But if he allows a home run, then a walk, then a single, and then strikes out the side—that’s looks like a much better outing than the first.
Despite allowing the same base stats (a home run, a single, and a walk), cluster luck takes the sequence of events into account. And the Cardinals led the league in cluster luck (according to BaseRuns). If you’re new to cluster luck and are still a little confused on how it works, check out this piece.
The Cubs enjoyed above-average cluster luck last season, and although this might not seem like luck to you, it’s certainly not what you want to see from your closer in the ninth:
Rondon had a terrible inning: he allowed a single, a double, and then hit a guy. Bases loaded, nobody out with a two-run lead in the ninth. But he proceeded to strike out the side, which meant all was forgiven on that day. Had he hit a guy first, then allowed the single, and then allowed the double, things would’ve been very different.
Quantifying Luck
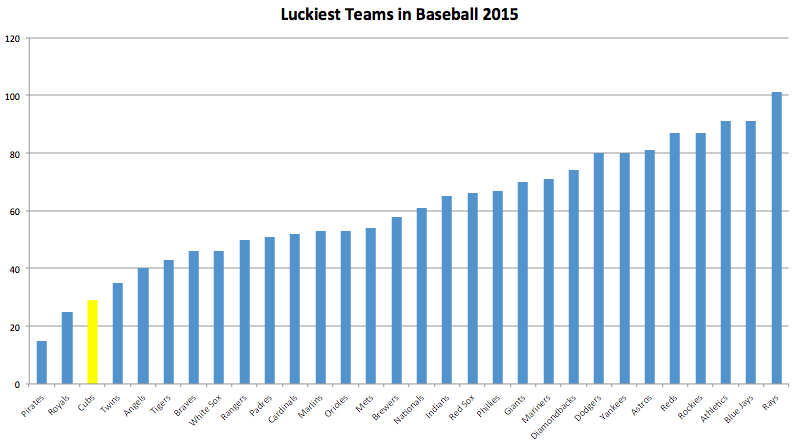
I wanted to take a holistic view of all these factors to see how lucky or unlucky the Cubs were relative to the rest of the league. So I ranked each team on all the above categories: record in one-run games, record in extra-inning games, WAR lost due to injury, and cluster luck. I decided to just leave the rookie production stuff out since it was such an anomaly last year and the Cubs kicked everyone’s butt anyway.
I’ll show you a table with all that information at the end of the article, but here’s how teams stacked up—and remember, the lower the number, the luckier the team was:
This helps explain some of the reason why the NL Central was such a beast division this year. And if it wasn’t for their last-place rank in the injury department, the Cardinals would’ve been in the top five as well. And if you’re curious about what 2014 was like, the Cubs ranked 22nd in the league (pretty unlucky).
Here’s how everything shook out in each category:
| Injuries | Extra Innings | One Run | Cluster Luck (FG) | Overall Luck Score |
||||||
| WAR Lost | Rank | Win% | Rank | Win% | Rank | +/- | Rank | |||
| Angels | 2.54 | 12 | 0.417 | 22 | 0.544 | 2 | 7 | 4 | Angels | 40 |
| Astros | 4.48 | 19 | 0.571 | 8 | 0.480 | 25 | -11 | 29 | Astros | 81 |
| Athletics | 0.99 | 8 | 0.412 | 23 | 0.465 | 30 | -12 | 30 | Athletics | 91 |
| Blue Jays | 12 | 29 | 0.571 | 8 | 0.467 | 28 | -8 | 26 | Blue Jays | 91 |
| Braves | 1.48 | 9 | 0.308 | 27 | 0.529 | 3 | 6 | 7 | Braves | 46 |
| Brewers | 0.31 | 6 | 0.444 | 19 | 0.500 | 14 | -2 | 19 | Brewers | 58 |
| Cardinals | 15.63 | 30 | 0.500 | 16 | 0.525 | 5 | 11 | 1 | Cardinals | 52 |
| Cubs | 2.74 | 14 | 0.722 | 2 | 0.529 | 3 | 3 | 10 | Cubs | 29 |
| Diamondbacks | 4.46 | 18 | 0.500 | 16 | 0.489 | 23 | -1 | 17 | Diamondbacks | 74 |
| Dodgers | 3.37 | 16 | 0.400 | 24 | 0.491 | 20 | -3 | 20 | Dodgers | 80 |
| Giants | 2.2 | 11 | 0.545 | 13 | 0.475 | 26 | -3 | 20 | Giants | 70 |
| Indians | -0.1 | 4 | 0.556 | 11 | 0.485 | 24 | -8 | 26 | Indians | 65 |
| Mariners | 3.16 | 15 | 0.435 | 20 | 0.498 | 16 | -3 | 20 | Mariners | 71 |
| Marlins | 3.7 | 17 | 0.667 | 4 | 0.506 | 9 | -4 | 23 | Marlins | 53 |
| Mets | 8.2 | 25 | 0.600 | 6 | 0.503 | 10 | 0 | 13 | Mets | 54 |
| Nationals | 5.07 | 21 | 0.818 | 1 | 0.500 | 14 | -7 | 25 | Nationals | 61 |
| Orioles | 1.94 | 10 | 0.545 | 13 | 0.497 | 18 | 2 | 12 | Orioles | 53 |
| Padres | 7.51 | 24 | 0.583 | 7 | 0.503 | 10 | 3 | 10 | Padres | 51 |
| Phillies | -0.05 | 5 | 0.400 | 24 | 0.466 | 29 | 4 | 9 | Phillies | 67 |
| Pirates | -2.5 | 2 | 0.571 | 8 | 0.545 | 1 | 7 | 4 | Pirates | 15 |
| Rangers | 9.68 | 28 | 0.556 | 11 | 0.512 | 7 | 7 | 4 | Rangers | 50 |
| Rays | 8.47 | 26 | 0.133 | 30 | 0.490 | 21 | -6 | 24 | Rays | 101 |
| Red Sox | 6.11 | 23 | 0.500 | 16 | 0.503 | 10 | -1 | 17 | Red Sox | 66 |
| Reds | -2.1 | 3 | 0.294 | 29 | 0.469 | 27 | -9 | 28 | Reds | 87 |
| Rockies | 9.64 | 27 | 0.375 | 26 | 0.490 | 21 | 0 | 13 | Rockies | 87 |
| Royals | 2.68 | 13 | 0.625 | 5 | 0.519 | 6 | 11 | 1 | Royals | 25 |
| Tigers | 0.67 | 7 | 0.529 | 15 | 0.510 | 8 | 0 | 13 | Tigers | 43 |
| Twins | -3 | 1 | 0.429 | 21 | 0.503 | 10 | 10 | 3 | Twins | 35 |
| White Sox | 4.55 | 20 | 0.722 | 2 | 0.498 | 16 | 5 | 8 | White Sox | 46 |
| Yankees | 5.33 | 22 | 0.308 | 27 | 0.497 | 18 | 0 | 13 | Yankees | 80 |
The Cubs have had a very busy offseason—some saying they’ve had the best offseason in baseball. They’ve added Ben Zobrist, Jason Hayward, and John Lackey while dealing only Starlin Castro. They might not be done, either. Why is a 97-win team making so many moves? Why did Theo & Co. think they had so many weaknesses to address as soon as the season ended? Shouldn’t a team that won 97 games have a couple of minor things to tweak in order to repeat their performance? The truth is the 2015 Cubs had a freakishly good year in terms of luck, and in order to make it back to the playoffs, they needed to be substantially better and deeper going into next year.
Luckily for the Cubs, they’ve done that and more.
Lead photo courtesy of Matt Marton-USA TODAY Sports


This is great stuff.
Thanks Jim! I appreciate it!
Nice. This explains quite a bit, and not only about the Cubs season. I wonder how long this type of analysis has been in use, and how widespread it is.
Not sure how widespread it is, but I know teams look at each of these categories quite a bit. I know I do—I just had never tried to compile them into one general view.
Thanks for the feedback!
I would be interested to see this done for the 2003 & 2004 Cubs.
Third order wins were really only one less than they actually won, however. This strips out the one-run-win, extra-inning, and clustering luck elements. The rookie performances- generally (outside Schwarber), were heavily weighted by strong base running and defense- which you wouldn’t expect to regress solely because of luck, as well. Health, I can’t argue with- and injuries to Lester and/or Arrieta would have a substantial negative impact on their outlook.
I’m not sure I understand how you scaled this. It looks like you just added up the ranks for each category–but that doesn’t correct for which categories are weighted more(ie shouldn’t it be all put in terms of WAR added or lost, or some common factor)?
Griffin, you’re right, I simply added the rankings to get the overall numbers. I wanted a score that simply evaluated how lucky each team was relative to the rest only taking these characteristics into consideration.
I ran these for 2014 as well and found that there was little to no correlation between where teams ranked one year versus the next.
Thanks for reading and sharing your thoughts!
Gotcha, thanks for the reply, love the content!