The Cubs’ starting pitching staff has collectively assembled a season to this point that rivals that of any other staff in baseball, if not surpasses them. And what makes this even more interesting is the fact that they are doing this in part on the backs of a couple of pitchers who are outperforming their pedigree, or so it would seem. When compared to last year, each pitcher has shown marked improvement, with Jake Arrieta being the only exception, though it seems hardly fair to compare 2015 Jake Arrieta to anyone, even himself. A quick scan of some of the basic statistical indicators would probably leave little room for understanding just how this is happening, so the easy culprit here might just be luck when looking for an explanation. That’s an easy scapegoat, after all. If the BABIP is down, just assume it’s a spot to watch for regression and move on, right? Not really. At least in the Cubs’ staff’s case, it’s much more than that.
Here, we’ll focus on each of the starting pitchers individually, as both Ben Lindbergh at FiveThirtyEight and August Fagerstrom at Fangraphs have looked at the staff as a whole in recent weeks. Today the focus is on Jon Lester, who seems a good fit with his start against the Reds tonight looming.
The idea that Lester is having a good 2016 season isn’t exactly a hard sell, but the idea that the dropoff in BABIP, oppTAv, and ERA, and the jump in cFIP as a product of skill—both on the part of Lester and the defense behind him—rather than simple luck might be a harder one. For some frame of reference, let’s look at the difference in these numbers from 2015 to 2016:
| BABIP | oppTAV | ERA | cFIP | |
| 2015 | .304 | .257 | 3.34 | 82 |
| 2016 | .263 | .251 | 2.10 | 93 |
Assigning these changes to luck would be a simpler explanation and would make for a much shorter piece, but it would be at best misleading, and at worst just flat out inaccurate. I’ll argue perhaps somewhere in between, but let’s err on the side of inaccuracy, as I think any explanation otherwise would leave out key elements such as type of contact, defensive alignments, and even pitch velocity and movement.
First of all, the defense that works behind Lester in 2016 is markedly better than even that of last season. Much of that has to do with the addition of Jason Heyward, but recent call ups of players like Albert Almora, Jr. plays a role there as well. The change in defense extends beyond just new faces, however, as Dexter Fowler has made changes to his defensive alignment as well. As noted in Mike Petriello’s piece on MLB.com early last month, Fowler has lined up significantly deeper in center field this season, and this is a part of a general approach in the outfield that Joe Maddon has encouraged, “To get guys a little bit deeper is probably the right thing to do. Keep the extra-base hit out of it and permit the single.”
What difference has this made? In Fowler’s case it has at least contributed to a change in his DRS of -12 in 2015 to 2 this year. Along with that, right field was largely manned by Jorge Soler last year, and the change from Soler to Heyward defensively probably doesn’t need to be spelled out here, but again in terms of DRS, Soler’s was -8 in 2015, and Heyward’s is already at 11 so far this season. To go with this, David Ross has a bit of an uptick in his FRAA from last year, up to 4.6 from 4.4 in 2015, so in all, the defense that supports Lester and the entire staff is notably stronger than last season, and especially so in the outfield, where many of the extra base hits are prevented.
When looking at pitch velocity and movement, it can admittedly be harder to gauge a clear sense of the impact, but by looking at these changes and the whiff percentage and the rate at which batters are swinging, we can begin to get a look. We’ll focus on the two primary pitches he throws to get the picture. First, the four seam fastball:
| Velocity | Horizontal/Vertical Movement | Whiff Rate | Swing Rate | |
| 2015 | 92.84 | 5.74/9.64 | 5.76% | 37.15% |
| 2016 | 93.14 | 5.89/9.96 | 6.74% | 41.88% |
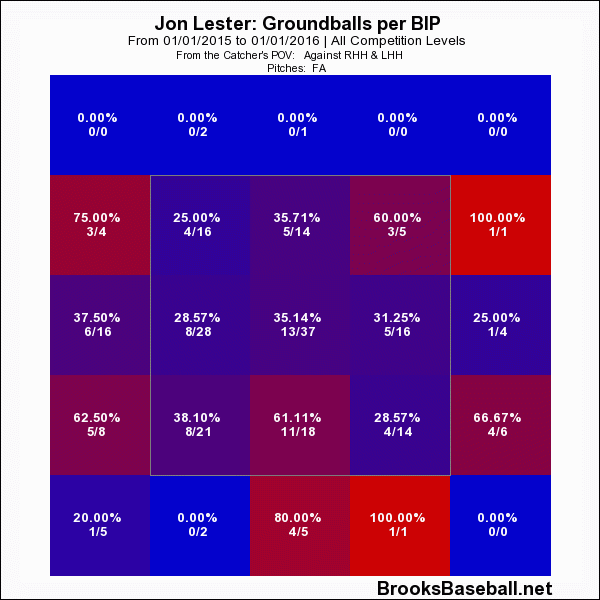
In summary, he’s throwing his four seamer harder, it’s moving more, batters are swinging at it more, and missing it more. And the type of contact against this pitch has changed as well. Here’s the difference in the groundball rate from 2015 to this season. First, take a look at 2015:
And then, compare that to this year:
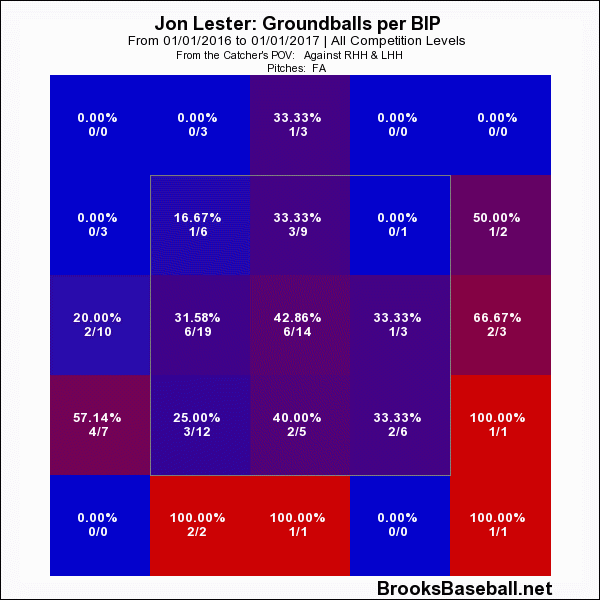
One of the notable changes here is in where the groundballs are being generated. It’s happening more frequently in different spots lower in the zone – something that could be a product of increased horizontal movement on the pitch, and contact lower in the zone does not often prove to be productive for the hitter.
Follow the same process with the popup rate, and there’s a slight increase there too. In general, the batting average against Lester has dropped and the ISO power against has gone down as well.
As for the cutter, his second most used pitch, let’s take a look with the same frame of reference:
| Velocity | Horizontal/Vertical Movement | Whiff Rate | Swing Rate | |
| 2015 | 88.75 | -0.09/4.81 | 14.27% | 56.52% |
| 2016 | 89.44 | 0.19/5.58 | 14.81% | 56.61% |
These differences are less pronounced than for the four seam fastball, but they represent some of the same things: He’s throwing it harder, it’s moving more, batters are swinging at it more, and missing it more. Like the fastball, the ground ball rate on the cutter has changed notably from 2015 to 2016, so the comparison is worth a look. Here’s 2015:

And then here’s 2016:

The difference here is more pronounced than with the fastball, but it illustrates the same idea: Jon Lester has so far thrown this pitch with greater velocity and movement, and it’s working. The sample sizes are a bit different, sure, but what 2016 has shown so far is a change in not only how some of these pitches are being thrown, but the results those pitches are yielding as well.
There are a great deal of variables involved in measuring the changes in a pitcher from one season to the next, and while the Cubs’ starting staff has so far represented an intriguing trend of improved performance, alongside all the indicators that we usually read as “luck”, it should be said of Jon Lester that his improvements cannot and should not be explained away simply by luck. He’s too skilled for it to be that simple.
Lead photo courtesy Steve Mitchell—USA Today Sports.
How much of an impact does Baez at 3rd and kb in left have on Lester’s performance? Kb over cogs in left?
I know kb hasn’t played much of yet, so sss applies, but any early indications of his ability out there? How he played that double off the wall and eventually got the runner at the plate a few games ago was bry-lliant!
That’s a good question, and to be honest, I don’t know that we’ve seen enough of their defense in those spots, particularly when Lester is pitching, to gauge it just yet. However, I agree, Bryant has been very impressive in the outfield so far!