My first exposure to Jason Heyward came, as it did for many Cubs fans, in the first at-bat of his career—a home run off of then-Cubs ace Carlos Zambrano. At the time, I remember being rather disappointed with the event itself (Zambrano’s final line for that game: 1 1/3 innings pitched, six hits, and eight earned runs), but weirdly at peace with the outcome. After all, Heyward was the number one prospect in baseball at the time, and his Hall of Fame manager had famously compared his hitting ability to that of Hank Aaron.
It seemed to me then that this would be the first of many great moments in a legendary career, and for the rest of his rookie season Heyward delivered on that promise, slashing .277/.393/.456 on the season. Heyward appeared to be the rare five tool player that was worth the hype. The next few seasons—in particular, a strong 2012—continued to build the legend, and multiple NL MVPs looked very much like a possibility. Two teams, three-and-a-half seasons, and just 42 home runs later, those accolades have not yet arrived. As he sits today on a slash line of .231/.322/.319, the question has to be asked: What’s happened to Jason Heyward?
First and foremost, I don’t want this piece to serve as either a referendum on Jason Heyward’s overall value or as the basis for an argument about whether the Cubs were correct or incorrect in signing him this past offseason. With hindsight it’s clear that, given the lukewarm acceptance of advanced defensive statistics (and especially their place as a component within WAR), that the first big contract given to reward DRS/UZR was always destined to be seen as controversial. But we’re not here to talk about his defense, which has remained superb. We’re here to talk about his offense, and to understand where Jason Heyward is right now as an offensive player, you first need to understand the peaks and valleys that led him to this point. I’ve compiled Heyward’s career OBP, SLG, K%, and BB% in the chart below.
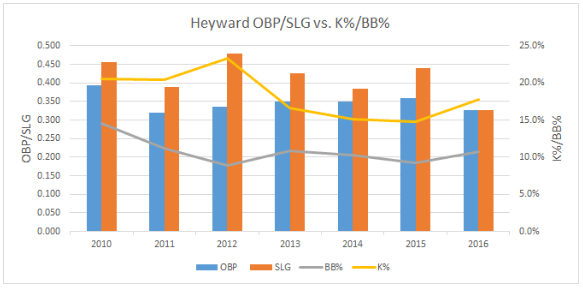
Let’s dive into this. Heyward’s career highs for OBP (0.393) and slugging (0.479) occurred in 2010 and 2012, respectively, at the absurd ages of 20 and 22. Unfortunately, he hasn’t approached these figures in any of his seasons since. The OBP decline makes some sense on the surface; it was largely driven by a walk rate close to 15 percent and a 0.335 BABIP in 2010. It seems reasonable that one, or possibly both, of these statistics would decline due to pitcher adjustments and/or a different, more aggressive approach intended to unlock his burgeoning power. But those two factors don’t explain Heyward’s abrupt decline in power immediately following his peak in 2012, with his slugging percentage decreasing each subsequent year with the exception of 2015. Since rate stats alone just scratch the surface, I dug deeper to see what has changed for Heyward since 2012.
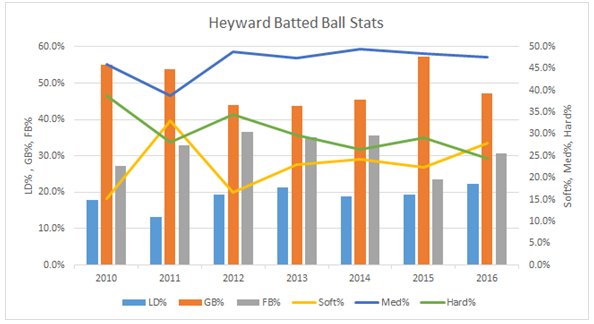
There are three clear trends that stand out here:
1. Heyward’s hard hit rate has steadily decreased since 2012;
2. His soft contact rate has steadily increased since 2012, and;
3. His ground ball rate, which fluctuated early in his career, reached almost 60 percent in 2015. Only four other qualified players had a higher ground ball rate that year (Christian Yelich, Dee Gordon, Jean Segura, and Cameron Maybin).
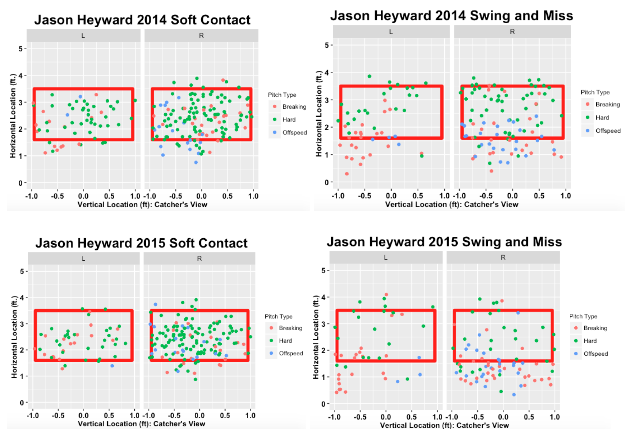
With this in mind, I set out to plot Heyward’s soft contact rate and swing and misses from 2012 to 2015 utilizing the pitchRx package developed by Carson Sievert, along with the ggplot2 package within RStudio, to see what types of changes might have occurred since 2012. I also included Heyward’s extra base hits from 2012-2015 in the initial plot below, broken out by pitch type and pitch velocity, as a reference to where in the strike zone Heyward has done his biggest damage.
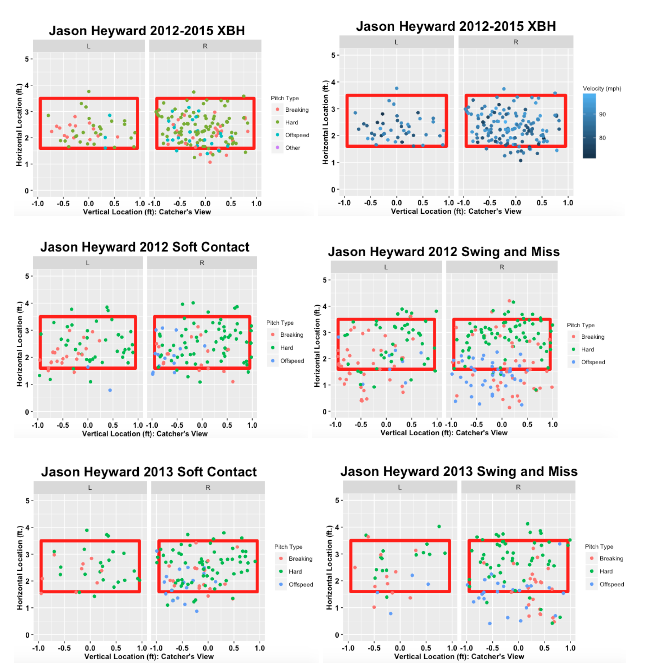 As you can see above, fastballs inside (particularly up and inside) did generate a large amount of soft contact/swing and miss from Heyward in 2012 and 2013. However, this trend did not continue into 2014, although not for the reasons Heyward may have hoped. Beginning in 2014 and continuing into 2015, fastballs delivered over the lower middle of the plate, which had previously been Heyward’s slugging zone, were now being turned into soft contact.
It’s readily apparent from the charts above that something changed on Heyward’s end subsequent to 2012-2013 that continues to hinder his ability to hit for power/hard contact. To be clear, I’m not the first person to make this observation. Peter Gammons, for example, has focused in on Heyward’s power regression by examining Heyward’s pre-swing setup. Gammons noted from 2010 to 2014, Heyward adjusted his pre-swing stance to become more open at his base and to have a more vertical bat angle. He theorized, at the time, that these changes were meant to enhance Heyward’s sweet spot in the lower portion of the strike zone, even at the expense of pitches in the upper third of the zone (Gammons cited Mike Trout as a comp in this regard). Since we know now these changes haven’t unleashed Heyward’s power, it’s important to try and figure out why he made these adjustments in the first place. To do so, interestingly enough, we need to go back to Heyward’s 2012 season.
In his 2012 season, Heyward had a career high 23.3 percent strikeout rate and a career low 8.9 percent walk rate. This worked out to a K%-BB% equal to 14.4 percent, good for a 56 percent (bad) increase from his 2011 figures and more than double his 2010 rookie campaign figures. 14.4 percent is, admittedly, not an outrageous figure, but it becomes slightly more concerning when you take a look at the typical player who profiles with these contact skills. Examples include Yoenis Cespedes’s 2014 season, Alejandro De Aza’s 2013 season, Rickie Weeks, Jr.’s 2010 season, Cameron Maybin’s 2011 season, and Nelson Cruz’s 2012 season. These are (or were), for the most part, good players, but they are players that need to hit 25-30 home runs regularly to compensate for their lack of on-base skills. I’m guessing the Braves, who had already had one high profile outfield prospect flame out due to lack of contact skills in recent memory, did not like the path Heyward was heading down and encouraged him to make adjustments to his swing.
Let me preface all of the following with the typical “I’m not a scout, so take everything I say with all of the grains of salt stored in that Morton plant right by the Clybourn Metra” thing, but I’m assuming the changes initially made subsequent to the 2012 season were done to ensure that Heyward made more contact. Particularly, I’m guessing the changes to open his stance and drop his hands from behind his head to just above his chest were meant to try and counter the previously-mentioned inside part of the plate that Heyward struggled with, and to shorten his swing stroke through the zone, respectively.
On the one hand, you could argue that these changes accomplished their original goal. Since 2012 (not including 2016 figures) Heyward’s average BB%-K% rate is 5.4 percent, and his strikeout rate decreased every year since (reaching a low of 14.8 percent in 2015). The downside, however, is equally clear. Unlike a certain third baseman/outfielder/Express model, not every young player can change their swing to a more contact-centric approach without sacrificing power, and Heyward proved to be no exception to this rule. Now ,it’s reasonable to ask why can’t Heyward just reverse his adjustments that he’s made during 2013-2015 and revert back to his 2012 approach. Unfortunately, there’s a painfully obvious thing that’s keeping Jason Heyward from elevating his power game: he has an unfortunate tendency to make hard contact at non-optimal launch angles. Case in point: refer to the exit velocity plots below, segregated by individual launch angle points.
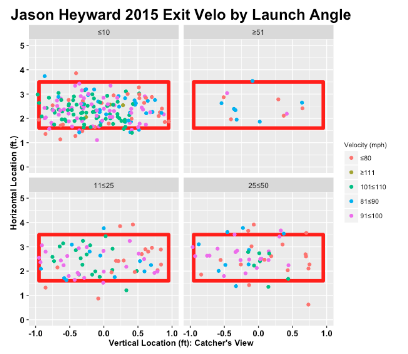
Of balls with exit velocities ≥90 MPH in 2015, Heyward’s average launch angle was only 7.6 degrees. That’s … not good. It’s not as if Heyward’s having trouble getting under pitches up in the zone; pitches at the belt or lower were hit hard, but hit into the ground.
To get an idea of how unusual this is, I took a look at the Statcast leaderboard for 2015 for all hitters with at least 100 batted ball events (375 players). For each player I took the difference between the player’s overall average exit velocity, on the one hand, and their corresponding average ground ball exit velocity, on the other. For this metric, negative values means average ground ball velocity > overall average velocity. The vast majority of players had a higher overall average exit velocity than average ground ball exit velocity (333 out of 375). Jason Heyward did not. His 2015 average ground ball exit velocity (91.7 MPH) was greater than his overall exit velocity (90.7 MPH). Only eight players had a lower net exit velocity (led by Jarrod Dyson at -3.2 MPH) after taking into account average ground ball exit velocity. And that’s tough to work with. In an era filled with exotic defensive shifts, no matter how hard you hit ground balls, they are usually converted into outs.
This all leads up to Heyward’s 2016 season where, unfortunately, old habits have proved difficult to break. Of the 40 hardest-hit balls Heyward has hit in 2016 by exit velocity, the average launch angle has been only 4.6 degrees. So, despite a conscious effort to elevate the ball in 2016, Heyward continues to have a non-optimal swing path to the ball, limiting the amount of power he could potentially hit for.
To be clear, the Cubs are still an immensely offensive talented team even with Heyward being a non-factor at the plate, and his defense late in close games could easily be the difference between a win and a loss. But as they face down another October duel with the Mets’ pitching staff, or if they have to contend with the Giants’ #evenyear magic, all hands have to be on deck. Maybe Heyward’s wrist heals and his movement out of the second spot in the lineup will pay dividends with his exit velocity catching up with his increased launch angle. Maybe Heyward puts it together in the second half this year or works hard next offseason and has a great 2017. Or maybe when you consistently make plays like this it doesn’t matter what you do offensively since baseball has evolved to the point where all around skills previously overlooked are now adequately compensated. Maybe. Or maybe not. But if it’s going to happen, it would be good if it happened sooner rather than later.
Matt Petit, special to BP Wrigleyville for this piece, is a consultant in the financial services industry who grew up near and now resides in the Windy City. He likes to think of himself as level headed, but he once ate an entire box of Golden Grahams during a Cubs playoff season-ending loss, so it’s probably best that you decide for yourself. You can follow him @petitt_matt.
Lead photo courtesy Andy Marlin—USA Today Sports.
Do you buy into the myth/legend/rumor at all that he’s still in his own head after getting hit in the face in 2013? I read an article in the past saying that he isn’t pulling the ball nearly as much/as often with the hypothesis that he’s still not fully committing to turning on the ball…