The Chicago Cubs entered the 2016 season as the consensus favorite to win the World Series, with no shortage of intriguing options on the mound and in the field. For me, the area that stood out above the rest was the growth and development of the offense. After the always dependable (but still only 26-year-old!) Anthony Rizzo, an abundance of questions lingered. Could Kris Bryant avoid a sophomore slump? Could Jason Heyward replicate his solid 2015 season at the plate? What would Kyle Schwarber and Jorge Soler do as an encore after a combined eight home runs in the 2015 postseason? Could Dexter Fowler continue to spark the offense from the top of the order after his surprise return?
If you’ve followed the Cubs closely thus far during 2016, you know that the answers to thosequestions are a mixed bag. Despite the injuries to Soler and Schwarber, and the generally ineffective offense of Jason Heyward, the Cubs have scored the fourth most runs in the bigs, and have maintained the fifth-highest team OPS so far during 2016, a credit to the organizational depth brought on by the “grow the bats, buy the arms” philosophy. That said, despite outstanding performances by Rizzo and Bryant (.326/.408/.637 and .290/.408/.597, respectively, during June and July), it feels as though something has been missing from the offense since it reached its peak earlier in the year. The Cub’s monthly runs per game chart below confirms this.
| Month | April | May | June | July |
| 2016 Cubs Runs Per Game | 6.2 | 5.0 | 5.0 | 4.38 |
Thus with Schwarber out for the year, Soler’s role on the 2016 Cubs very much in question, and no impact bat coming via trade, the Cubs will have to count on internal improvement to regain their offensive consistency to supplement the brilliance of Bryant and Rizzo. With this in mind, Dexter Fowler may have to share his “You go, we go” tag with another switch-hitting veteran: the pride of Olivet Nazarene University, Ben Zobrist.
Ben Zobrist’s 2016 offensive performance can be broken down into three parts:
- The solid start in April that matched his career averages, followed by his scorching success in May during which time he compiled an OPS of 1.137.
- The abrupt decline in June; his overall OBP fell from .446 at the end of May to .414 at the end of June.
- The semi-recovery in July, aided greatly by his final 10 game slash line of .371/.463/.629.
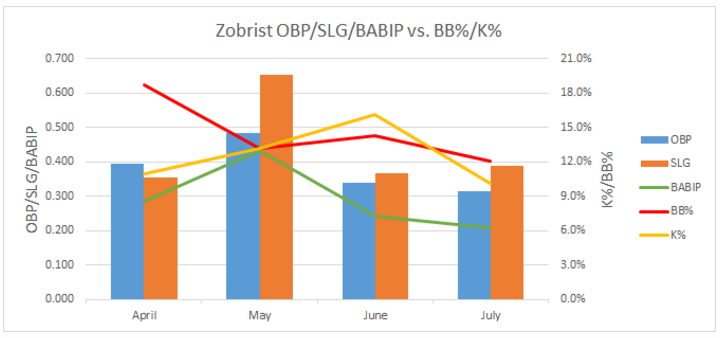
As you can see from the chart below, there were no drastic overall changes in Zobrist’s walk rate vs. strikeout rate since May, so the decrease in overall performance beginning in June seems to be driven primarily by the decrease in Zobrist’s BABIP.
.
Meanwhile, in the chart below, I’ve plotted Zobrist’s Statcast exit velocity and launch angle averages from the beginning of the 2016 season to 7/31/16.
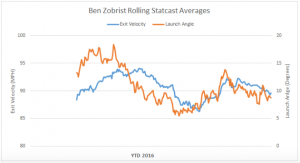
The Statcast data confirms that Zobrist’s season can, indeed, be divided into three parts. The increase in BABIP in May 2016 wasn’t just driven by luck; Zobrist was consistently hitting the ball hard, and at optimal launch angles throughout a major portion of May. Unfortunately, Zobrist’s launch angle started falling just after halfway through May and by the end of the month his exit velocity had begun decreasing as well. This decrease continued for both statistics throughout Zobrist’s dismal June, before Zobrist began righting the ship just prior to the All Star Break in July.
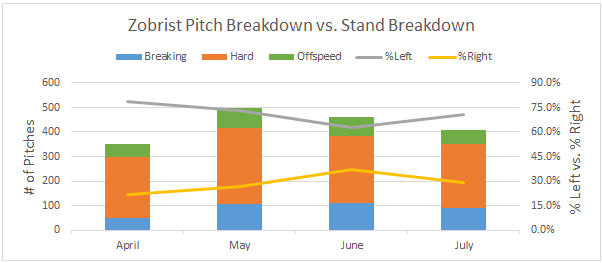
To figure out what underlying factors caused this increase in soft contact, I took a look at Zobrist’s pitch breakdown and pitch location for each month. It’s important to remember that while Zobrist is a switch hitter, his power comes primarily from his left side as he has hit almost three times as many home runs (104 vs. 36) as a left hander. This trend has continued in 2016. Not only is Zobrist’s slash line from the right side of the plate slightly weaker this year (R: 292/.385/.434 vs. L: .274/.388/.460), but his strikeout rate (R: 18.5 percent vs. L: 10.4 percent) and walk rate (R: 11.3 percent vs. L: 15.7 percent) are also worse.
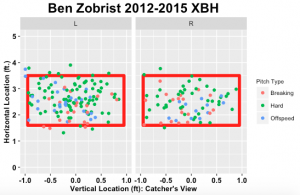
In conjunction with the chart above, I’ve plotted the location of pitches by month thrown to Ben Zobrist below to see what types of changes might have occurred throughout the 2016 season. Additionally, I have included the location of Ben Zobrist’s extra base hits from 2012-2015 as a reference.
Before we delve into each of these, keep in mind that Ben Zobrist takes the majority of his at-bats as a left hander (71 percent of pitches seen so far in 2016 were as a left handed batter), so a density of 0.2 on the right side is not equivalent to the same number of pitches as density of 0.2 on the left side.
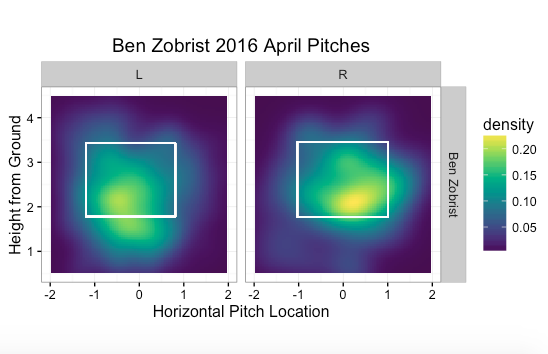
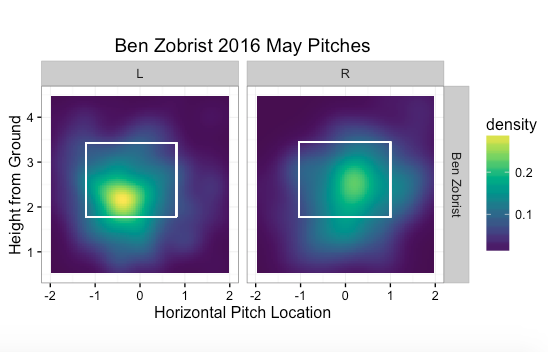
While there wasn’t a discernible pattern to how pitchers approached Zobrist in April 2016, there were clear changes in how pitchers approached Zobrist in May. Whether it was because runners were constantly on base or that Cub hitters were consistently working the pitch count to fatigue a pitcher into making mistakes is not clear. As demonstrated from the “Ben Zobrist 2016 May Pitches” plot above, pitchers started consistently challenging Zobrist over the lower middle of the plate, within striking distance of the sweet spot from the 2012-2015 XBH plot above. And judging from his May slash line and Statcast data, he made them pay for it.
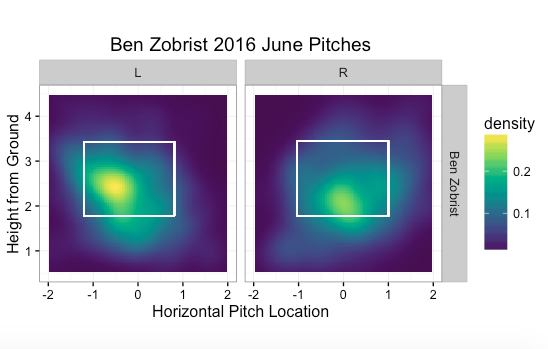
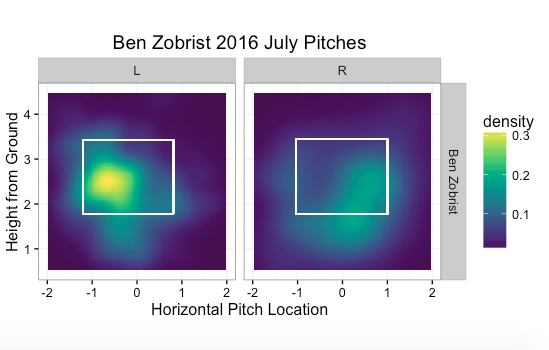
Then we get to June. Since Zobrist was by most measures the best hitter in the NL in May, it’s safe to say pitching staffs across the MLB began to game plan against him differently. Beginning in the June plot above, there was a concerted effort to attack Zobrist middle away and Zobrist had trouble adjusting. He specifically had trouble getting under the ball, which is shown by the decreasing launch angle in the Statcast plot, and also by the 54.7 percent groundball rate Zobrist produced in June (up from 41.7 percent in May). Additionally, whether this is coincidence or due to opposing managers strategy isn’t clear, but Zobrist hit from the right side of the plate for 37.2 percent of pitches seen in June 2016, up from 26.6 percent in May and 21.6percent in April. As discussed earlier, Zobrist is a better hitter from the left side of the plate and the increase in right handed at bats certainly did not help his slash line.
This takes us into July. Pitchers continued pounding Zobrist middle away, but in July he seemed to have made the necessary adjustments as both his moving average exit velocity and launch angle rose above 92 mph and 13 degrees, respectively, just prior to the All Star Break. Also helping matters, Zobrist hit from the left side for 71 percent of pitches seen in July. However, post-All Star Break Zobrist has seen his exit velocity and launch angle drop off somewhat. Incidentally, his final 10 game slash line (7/22-7/31) of .371/.463/.629 that propelled his July figures past his dismal June line, came as both his moving average exit velocity and launch angle decreased from their mid-July highs. This could just be small sample size theater, but it bears watching during the stretch run whether or not Zobrist can continue his early July success, specifically against pitches middle away.
I’m guessing when Ben Zobrist signed with the Cubs this past offseason he didn’t envision himself as the club’s primary cleanup hitter and main source of protection for Anthony Rizzo/Kris Bryant, but here we are in early August and that’s exactly what happened. Whether or not Zobrist can consistently make solid contact at middle away pitches will go a long way in determining the type of stretch run he will have. In essence, the adjustments Zobrist is faced with are what baseball is all about; success is a constantly fleeting target, and the players that are able to subtly reinvent themselves consistently are the ones who stick around. Judging from his MLB track record and his rise from humble beginnings, Zobrist is quite adept at doing so. I’m suspecting this time will be no different.
Lead photo courtesy John Hefti—USA Today Sports.
Thanks Matt. Great deep dive. But remember, Zobrist is naturally a righty hitter, and OPSd far better from there last yr (.900+), while maintaining very consistent splits in his career.
Bigger Q is why Joe keeps batting him 4, instead of 2, where he is ideal. In fact, any one of Zo, Russell, Baez, or Contreras at 2 would be amazing. We already know what Zo can do there, but wanna see the youngsters really explode? Watch what happens if any of them bat in front of Bryzzo.
The most inarguable no-brainer remains Joe’s arrogant, stubborn insistence on keeping his worst hitter–Heyward, BY A MILE–killing us in the middle of the lineup. He did the same w/ Castro last yr, til the drastic benching. McCutchen got benched, Gomez RELEASED; how much longer til Joe at least sees the minimal light and bats Heyward 8th?