Good old Ben Zobrist. You always know exactly what you’re getting from him: great patience, solid average and power, and the kind of positional flexibility that helps Joe Maddon sleep at night.
His TAv has been over .280 for six straight years; his wRC+ has never been below average since he became a major league regular. Let’s check in then with the Cubs’ most experienced position player.
Oh. This doesn’t look right at all. A .197 average? 8.5 percent line drive rate? Am I reading the right player card? Looks like I am. Very strange. (Editor’s note: Stats current as of April 27)
Before we dive any deeper into this uncharacteristic start, it should be mentioned that Zobrist has been dealing with a stiff back and Maddon hasn’t hesitated to give him days off, or play him in right field, and use Javier Báez at second instead. As a result, we shouldn’t be surprised if Zobrist ends the season with significantly less than a full season of playing time.
The Cubs might not be ready to say they don’t need Zobrist as a regular, though. While Báez is unquestionably stellar in the field, his approach at the plate is anything but. There’s immense talent there, but he might also be the opposite of his teammate at the plate in terms of selectivity and patience.
Look, it’s the end of April. Teams have barely played an eighth of their games, and Zobrist has come to the plate just 72 times. We might feel like this is the kind of time when certain stats are starting to stabilize, but as BP’s Russell Carleton pointed out last week, that really doesn’t mean what you think it means. We shouldn’t leap to any conclusions just because we’ve passed some plate appearance thresholds.
If we can’t say with any degree of confidence that this is likely to continue, we can at least consider whether Zobrist has struggled to this extent before. On a basic level, it’s reasonable to say that this is his worst month for quite some time. Setting an 80 PA minimum, Zobrist hasn’t had a monthly OPS this low since August 2010, when he provided a .511 OPS and 51 wRC+, mired in a slump that lasted virtually the entire second half.
By contrast, April 2017 looks great, until you realize that Zobrist has not had a wRC+ worse than 91 in any full month since that 2010 disaster, so his current 81 would be quite the drop-off if it holds through this weekend. This is a testament to Zobrist’s incredible consistency, as even at his worst, he has been essentially only slightly below average in any given month over the past six years. It’s also another reason for concern because it makes it that much more notable that his performance has been poor.
Months are hardly a consistent unit of measurement, however. We can do better. FanGraphs has a tool that provides rolling x-game line graphs of a player’s performance, available for everything from stolen bases to contact rate. In addition to being an excellent way to show just how ridiculously volatile baseball performance is over such a sample, it’s also a very quick and easy way to see whether a player is hitting new highs, or in this case, plumbing new depths. So has Zobrist gone through 17-game stretches like this before?
A line drive rate in the single digits sounds incredibly low, but in fact Zobrist has had 17-game spells with a lower LD% on five separate occasions. However, he hasn’t been this low since early 2014, and has not failed to hit fewer than 18 percent line drives over a full season since 2010.
His contact rate decline is far from unprecedented. Zobrist has dipped around this low at least once in every season of his career, although he has been a much better contact hitter since the second half of 2013. A slump in June last year actually saw his 17-game contact rate dive to 77.8 percent, a mark which is still vastly superior to the 70 percent he approached at least once a year prior to 2013.
While the standard plate discipline and batted ball data is within reasonable expectations for such a sample, the Statcast data doesn’t offer much room for optimism. Zobrist hasn’t been crushing the ball and getting unlucky, he’s been hitting like Jordy Mercer. That might even be unfair to Mercer, who has twice as many batted balls that left the bat going at least 95mph. Zobrist has just nine, less than 20 percent of all his batted balls and barely more than perhaps the most slap-hitting slap hitter in the game at the moment, Billy Hamilton, and one-time Twins super-prospect Byron Buxton, currently responsible for a .420 OPS.
The 35-year-old also has just one ‘barrelled‘ ball all season out of 46 recorded batted ball events. Here’s what happened to it:
He doesn’t belong at the top of the Barrels leaderboard, with the likes of Giancarlo Stanton and Aaron Judge – that’s not the kind of hitter he is. However, Zobrist did manage the feat 20 times last season, and even when his batted balls weren’t hit quite that well, they were being hit a good amount harder.
This isn’t to say that Zobrist has lost the ability to do it, because we just saw him do it, but last year he was doing it a lot more often. His average fly ball and line drive exit velocity in 2015 and 2016 was 92.6mph; this year that’s dropped by almost 3mph. Here’s Zobrist’s rolling 50-game exit velocity, courtesy of Baseball Savant, with my own hi-tech baseline added for effect.
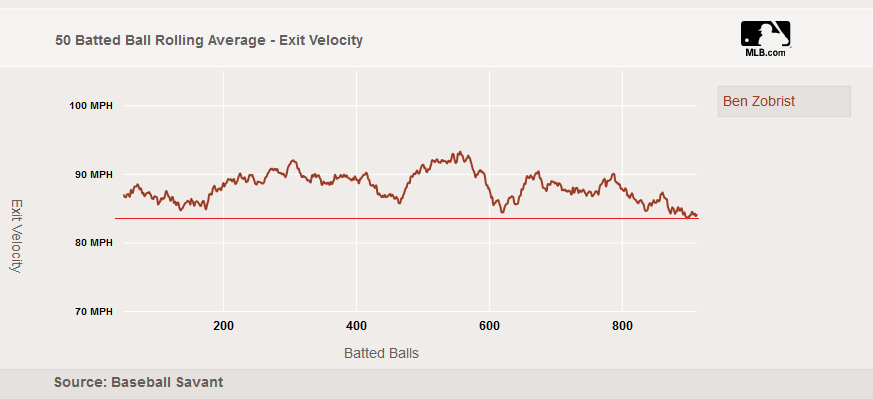
Once again, it’s clear to see how much such statistics fluctuate over small samples, but it’s also clear to see that Zobrist’s average exit velocity is at its lowest since Statcast was introduced in 2015. His average launch angle has risen by almost 5 degrees, now close to 29. That’s a great angle if you’re hitting the ball very hard, and probably not so much if your power is more of the line drive, double variety. Zobrist hasn’t put the bat on the ball like he did for that home run very often.
He is walking, as he always does, and his BABIP is just .222, suggesting some positive regression. However, that BABIP might be largely deserved, given the way he has been hitting the ball so far. Zobrist has not been an unlucky starter: He simply hasn’t been making particularly good contact. Maybe the weaker contact is due to his back affecting his power slightly; maybe this is simple small sample size fluctuation.
Zobrist has been an almost continuously productive player during his time in the majors and it would not be at all surprising to see improved at-bats and an uptick in production to match his established level of performance. He’s also a soon-to-be 36-year-old with some extremely uninspiring batted ball data and a nagging back issue. It would be similarly unsurprising if this was simply the start of his decline, as Ken Schultz wrote in the offseason.
The fact that this month is an outlier is great. If it becomes the start of a trend instead of an outlier, Báez is going to need to improve at the plate, or the Cubs might not have even one good second baseman, let alone two.
Feature image courtesy Charles LeClaire—USA Today Sports
Great article Darius, I’m surprised you didn’t go with “Ben Slowbrist”.
Thanks Tom – I couldn’t bring myself to do it in the end. Best to leave that to more seasoned pun-masters.
Had this article in the queue when Zobrist blasted an HR over the Green Monster
I’m happy to help him turn it around.
Darius,
Interesting article. I have a question related to your BABIP comment:
“However, that BABIP might be largely deserved, given the way he has been hitting the ball so far. Zobrist has not been an unlucky starter: He simply hasn’t been making particularly good contact.”
Has anybody reported the correlation between BABIP and exit velocity? Seems plausible that there would be a relationship.
In short, it’s important, but so is launch angle – Baseball Savant has a table that breaks down results for each extra mph of exit velocity: https://baseballsavant.mlb.com/statcast_hit_probability. If you click the row, you can then see the breakdown for the launch angle at that speed too. Rob Arthur’s introduction at https://fivethirtyeight.com/features/the-new-science-of-hitting/ is good as well. His graph there of expected runs vs exit velocity is a pretty clear illustration of the relationship.