The Cubs are now 10 games over .500 a third of the way through, meaning they only have the seventh-best record in the league. Even considering that the Cubs have played the least amount of games of anyone, there has been a lot of monkey-in-a-zoo activity out here in the fandom wilderness—especially before their recent surge. Surely there must be some reason(s) the Cubs have not gone 45-6 as we all expected.
As I’ve said at times in the past, the 2016 team is still a standard/ghost that any team in the recent aftermath is going to have to live up to/be haunted by. 25-6 starts tend to stick in the memory. And hey, everything worked on that team. You can’t deny that. So each of the past two years, when the Cubs didn’t start that way, the conclusion was that something must be “wrong,” instead of just the natural variances of the game taking hold. Sure, last year’s team simply wasn’t as good as the one before, with injuries in the starting staff, and some new players in the lineup who took their time to find their hitting legs.
And, having watched the 2018 Cubs, you’d probably also conclude that this year’s team isn’t as good as 2016’s. Here’s the thing: it actually is? To wit:
2016’s team slash line: .256/.343/.429
This year’s: .266/.347/.434
That’s better in every line. Two years ago, the Cubs walked more at 10.6% of the time, whereas this year’s team walks at 9.8 percent. That’s just enough to notice, as it would have meant 12 more walks as a team so far. In 51 games. So not even one per every four games. So that thing about noticing? Yeah, no. Caught you there.
Most importantly, these Cubs are averaging 5.23 runs per game, whereas the those of Valhalla two years ago averaged 4.98. There’s obviously a long way to go, and the ’16 version started out on fire and cooled off for a bit in June and July. At the same point in the season in 2016, the Cubs were averaging 5.4 runs per game. So a touch better, but not in a significant way. In fact, they had scored just six more runs in 51 games than this bunch, which really adds up to one good day instead of one bad day.
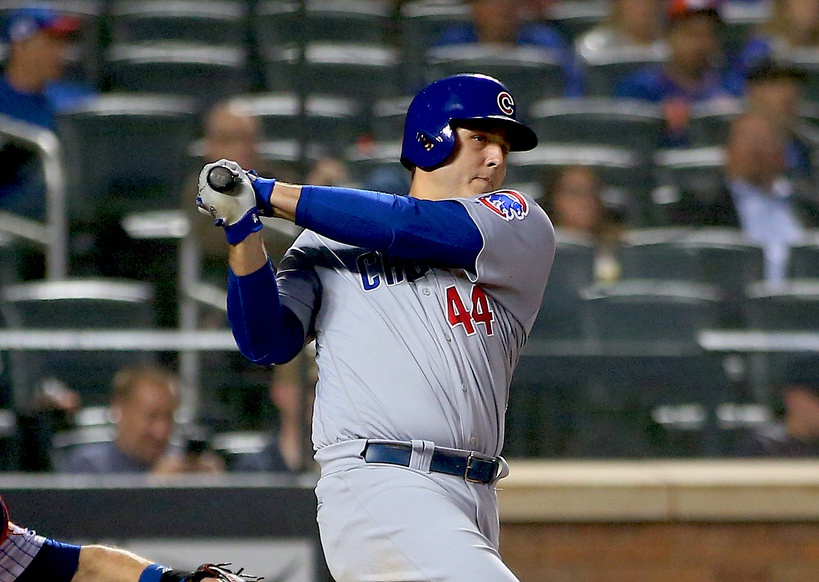
Looking up and down the lineup, one can get a sense of how this team could give the ’16 club a run for its money, offensively. The big thing here is this lineup includes a (now surging) Anthony Rizzo who’s either been hurt or basically Guy Incognito playing Anthony Rizzo for almost all of the season. 2016 most certainly did not have that. Kris Bryant also missed a week. And I don’t know what to tell you, but both Albert Almora and Ian Happ, at least offensively, are having basically the same season that Dexter Fowler did so far in terms of wRC+ (Fowler had a 128, Almora 123, Happ 128 as well). In terms of TAv, Fowler had a .312, Almora .275, Happ .297.
You’ll recall until the last two months or so of the 2016 season, left field was a mishmash of Jorge Soler, Chris Coghlan, Willson Contreras and Kris Bryant. Whoever was out there is clearly being matched or bettered by Schwarber’s .304 TAv, especially allowing for the fact that whenever Bryant was out there the Cubs were not getting much at third base (they weren’t, because it was usually Javy Báez there and he was… well, Young Javy). Zobrist isn’t hitting for quite the power that he did two years ago, but his additional starts in right are improving what the Cubs are getting from that position because Jason Heyward remains “The Ballad of 4-3″ mostly (with some improvements of late. #HopeSpringsEternal). And while Willson Contreras might not be hitting as he did when went all Atlas in the middle of last season, he’s still better than what the Cubs had in the first third in the Season of Dreams with David Ross and his pool noodle at the plate and Miguel Montero’s Tasmanian Devil act.
The only huge difference between these teams is how they do with runners in scoring position. This team even bests the 2016 club in hitting with runners on base, as this year’s Cubs hit .273 while Those Who Echo Through Eternity hit only .261. But their performance with runners in scoring position has changed. Two years ago, the Cubs hit .259. This year, it’s .238. And you can’t really chalk it up to luck, as this year’s bunch has a .297 BABIP with runners on second and/or third and ’16’s had a .296. What’s strange is the contact numbers in that spot are about the same. This year’s team has a 18.3 percent line-drive rate, and two years ago it was 18.9 percent. The difference is that 2016’s team came up with a 28.2 percent hard-contact rate in that spot overall, where this one only has a 26.4 percent rate. One would expect these numbers to improve when Rizzo puts it all together again, and if Addison Russell has a rebound he’s flashed a bit recently.
Overall, this team isn’t all that different from the one you have little cartoon hearts around all the time. At least at the plate.
Lead photo courtesy Andy Marlin—USA Today Sports
