One of the coolest benefits of writing for Baseball Prospectus—and there are a few, hashtag humblebrag—is that I get early access to the PECOTA projections, which were just released by BP last Tuesday. This allowed me the time to pore over the projected numbers for the Cubs and drool about the power potential therein. It shouldn’t surprise anyone that follows this team closely that the power numbers light up the boards for the Cubs, with three players projected for 30 or more dingers, five projected to hit 20 or more, and nine that should hit 10 or more round-trippers.
But is this the best power lineup the Cubs have ever had? It’s an interesting question, so let’s examine it. If we’re measuring by home runs, the 2004 Cubs knock this team out of the park—pun completely intended. That team crushed the franchise record, clubbing 235 taters and rushing past the mark set by the team that’s currently second on the franchise list, the 1998 Cubs. But a better question might be whether this 2016 Cubs team has the power more evenly distributed than any other team in franchise history. After all, if your power is all locked up in two or three players, you leave yourself vulnerable to injury.
Before we go any further, let’s go ahead and marvel at the PECOTA projections for the Cubs hitters in 2016. I went ahead and only included players that are actually projected to be on the major-league roster, so the eight homers PECOTA spit out for 250 plate appearances from Dan Vogelbach simply do not count.
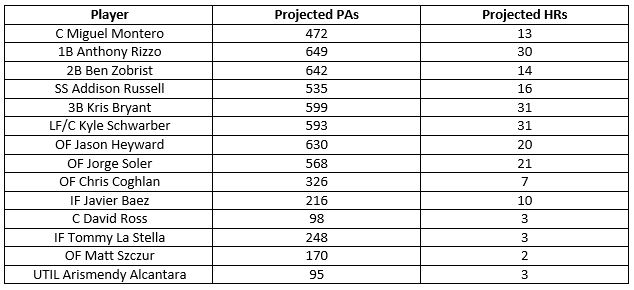
If you’re wondering, the 204 homers listed here would be good for fourth all-time for the franchise, behind only the aforementioned Cubs teams and the 1987 version, which comes in at third with 209. Assuming the Cubs have more than 14 position players on the roster this year there’s a decent chance they could challenge the ’98 Cubs for second place, which would require this year’s team to knock 213 bombs out of the park. But that really doesn’t get them close to the ’04 Cubs, and close only counts in horseshoes and hand-grenades anyway.
Of course, the game was different just over ten years ago. The ball was flying out the park at a greater rate back then, and offense is generally down around baseball. The 235 balls the Cubs deposited into the bleachers in ’04 represented 4.3 percent of all homers in baseball that season. On the flip side, if we assumed the same amount of home runs hit around Major League Baseball in 2016 as there were in 2015, the Cubs’ 204 homers would represent around 4.1 percent. That is to say, the difference between the two is fairly negligible.
So if the difference is negligible, then let’s see how the balance of the lineup compares to the best home run hitting teams of Cubs past. I took the top-five Cubs teams on the franchise home run list and compared their top home run hitter, including how homers he hit and what percentage of the team’s long-balls he accounted for.
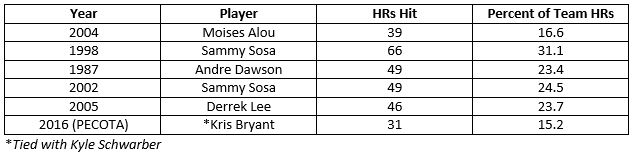
That ’04 team, as disappointing as they were in so many ways, still stand alone well above the rest of the teams in the top-five as far as power balance in the lineup. Two of the other teams had Sammy Sosa in right field in his prime, which obviously could make the home run totals for the team look more impressive. This also accounts for a 49-homer season from Hall of Fame outfielder Andre Dawson and a 46-homer season from Cubs legend Derrek Lee.
But again, based on the projections, the Cubs leader in home runs in 2016 comes in at a slightly smaller percentage of team homers than Moises Alou accounted for in 2004. At the very least, this shows that the 2016 Cubs should be at least as balanced as the ’04 Cubs—as far as power is concerned.
And home run power is where the comparisons stop. That ’04 team had a fatal flaw, which was the lack of ability to get on base—and a bad bullpen, but that’s a debate for another day. Despite being first in the National League in home runs, they were 14th in walks with a total of 479 (not counting pitchers). In franchise history, they ranked just number 56 in OBP and had a walk rate of 8.1 percent. This 2016 Cubs team, while also stacked with power throughout the lineup, can take their walks. Among just the position players projected by PECOTA, they come in with 566 combined walks and a 9.6 percent walk rate.
The 2008 Cubs, a team that won 97 games, walked the second most times as a team in franchise history. That team is also eighth on the franchise home run list with 184. If there were a direct comparison for the 2016 Cubs with another team from recent history, as an overall glance, that ’08 team might the one. They had a good balance of power and patience, which PECOTA seems to believe will be a characteristic of the current incarnation. As anyone old enough to remember watching the Cubs in 2004 can attest, power is a great asset but isn’t generally enough on its own. The fact that these Cubs contain the ability to hit the long ball and work a patient at bat, to me, is a big reason they may end up being the most balanced lineup in modern Cubs history.
Lead photo courtesy David Banks—USA Today Sports.
Ross is not going to hit 3 HRs
I agree Ross w/not hit 3-Depending where Schwarber hits he will pop 33-40,some weaker HR hitters will hit more than usual, because they will see better pitches no pitcher wants to walk Ross to have to pitch to the power hitters.