Earlier this week, my colleague Isaac Bennett dug deep into the rabbit-hole of the widely ranging PECOTA projection numbers for Cubs hitters. Fortunately, I was able to partner with Isaac on this PECOTA rabbit-hole adventure, so today, and without further ado, I bring to you the “what ifs” and the “maybes” of the Cubs’ starting pitching staff. Here we go…
Jake Arrieta
90th percentile: 211.9 IP, 145 H, 53 BB, 220 K, 16 HR, .244 BABIP, .93 WHIP, 2.34 ERA, 2.65 DRA, 5.9 WARP
What has to go right?
The first thing to understand with respect to these numbers is that Arrieta transcended expectations and projection systems throughout baseball in 2015, and that is unlikely to happen again. And that’s okay. Even at his ceiling, PECOTA does not have Arrieta throwing as many innings as he did in 2015, with the projections shaving 17 innings off his 2015 total. That might not be a bad thing. While the extra innings Arrieta totaled in 2015 were not the direct cause of his October results, they surely didn’t help the fatigued ace preform at his best when it was most essential.
Even in this scenario 90th percentile scenario, which Arrieta is more likely to make a reality than some others on this list, Arrieta is expected to regress to slightly more human totals. Just slightly, though. PECOTA interestingly has him posting nearly the same amount of strikeouts as 2015 (keep in mind the reduced number of innings), but an increase in walks, hits and home runs. This suggests that PECOTA may think Arrieta’s dominance will be more heavily accounted for by hitters, who are likely to become more patient at the plate, increasing strikeout risk, while also potentially garnering more walks and pitches to hit. PECOTA does not show Arrieta’s BABIP rising, but actually falling by two points, so hard contact and unlucky hits shouldn’t be something we worry about in 2016. This is an impressive, yet completely attainable outcome for Arrieta.
10th percentile: 177.1 IP, 162 H, 59 BB, 185 K, 18 HR, .301 BABIP, 1.24 WHIP, 4.00 ERA, 4.46 DRA, 1.4 WARP
What could go wrong?
In this scenario, contact will be Arrieta’s main downfall. With a K/9 still hovering at around 9, Arrieta will still be throwing the gas. However, with a BABIP rising to .300, he will be prone to making more mistakes between strikeouts. This is mostly reflected in the number of hits he will allow relative to the number of innings pitched. Let’s go back to his 90th percentile stats for a second; Arrieta is projected to allow just 145 hits over 212 innings. I’m no mathematician but my numbers show that this is a H/9 of around 6, while his projections in the 10th percentile give him an H/9 of around 8. Two extra hits may not seem like a lot, but in the proper context such as men on base, where the hits land, how hard the ball is hit, etc — those extra two hits per nine are the difference maker between a 2.34 ERA and a 4.00 ERA in 2016. Arrieta’s walks will also rise in this scenario, landing at a number that he has only matched once in his career, during his ugly days in Baltimore. This is indicative of either control issues rearing their ugly head, more patient hitters at the plate coupled with more mistakes, or mostly likely both. My thoughts are this situation will only come to be should Arrieta suffer one of those things that starts with an I and ends with a Y.
Jason Hammel
90th percentile: 173 IP, 134 H, 41 BB, 160 K, 18 HR, .251 BABIP, 1.01 WHIP, 2.96 ERA, 3.33 DRA, 3.5 WARP
What has to go right?
Let’s get the obvious out of the way: for this to happen, Hammel must remain healthy while putting up good first half and second half splits. These numbers imply that Hammel won’t be allowing as much contact, and in order for that to become a reality, he must stop allowing this to happen with his most frequently used pitch; his slider:
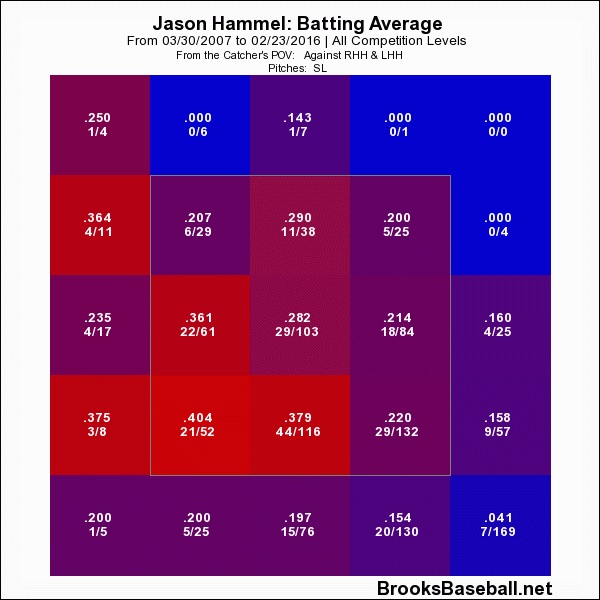
His walks will stay almost identical to is 2015, over approximately the same number of innings, so not much change there. To say that the strikeout rate seems aggressive is not entirely correct, as Hammel has posted 158 and 172 Ks over his last two seasons, respectively. Of course, these are the only two seasons in which he pitched 170+ innings and achieved such strikeout numbers, but that is most likely due to the fact that other seasons in which he posted 170+ innings his strikeout totals were lower due to park effects of Coors Field. Overall, I like these 90th percentile projections for Hammel as they’re realistic, but also very good.
10th percentile: 139 IP, 145 H, 44 BB, 129 K, 30 HR, .310 BABIP, 1.36 WHIP, 4.78 ERA, 5.31 DRA, -0.2 WARP
What could go wrong?
In this scenario, Hammel has either made a trip to the DL or only lasted around 5 innings per start. Both are plausible; both are not good signs. The spike in hits over considerably fewer innings is an even worse sign. Hammel has always shown walk rates in the 40s (when pitching over 118 innings), so control won’t seem to be as much of an issue as command. However, the bright side of this situation is that even if Hammel should hit his 10th percentile mark, he still won’t give up as many home runs as he did in 2015. Another interesting takeaway from this is that, unlike his other counterparts, in this scenario Hammel’s ERA will only have risen one run compared to his actual 2015 ERA. There is always a bright side.
Kyle Hendricks
90th percentile: 166 IP, 130 H, 38 BB, 144 K, 15 HR, .253 BABIP, 1.01 WHIP, 2.82 ERA, 3.17 DRA, 3.7 WARP
What has to go right?
First of all, Hendricks’s spring needs to go well in order for him to secure a role as fifth starter over newcomer Adam Warren, or else these numbers won’t be much of a reality at all. Once he does that, these numbers are not entirely out of reach for Hendricks. As expected for a finesse pitcher of Hendricks’ type, his home run tally will still be a bit high, as will his walks, but as I said, that is to be expected. A stat such as BABIP is what needs to be kept nip tuck for a pitcher like Hendricks. He will need to keep the linedrive rate to a minimum (it crept up by three percentage points in 2015) and be adequately prepared to field his own grounders. That, or have faith in the offense to effortlessly field the contact he allows, getting him out of trouble. A 2.82 ERA is really not all that hard to imagine for Hendricks, given that his first year in the majors he posted an ERA of 2.46 over 80 innings. In the latter months of the season, Hendricks’ changeup showed significant strides, improving from an 11 percent whiff rate in April to a 34 percent whiff rate by September. If he is able to continue inducing swings with the offering and using it as his get-me-out pitch, coupled with his sinker, the strikeouts we see here could become a realistic game changer for Hendricks.
10th percentile: 131 IP, 139 H, 41 BB, 114 K, 16 HR, .315 BABIP, 1.38 WHIP, 4.57 ERA, 5.08 DRA, 0.2 WARP
What could go wrong?
Finesse pitchers are interesting. One minute they can be producing the most beautiful sequences you feel like you’ve ever seen, inducing perfect groundouts for quick one-two-three innings, and simply making you shake your head in amusement. But other times, finesse pitchers can be wild and erratic, allow contact that is downright unwarranted, and let balls leave the park that were so slow and poorly located that they deserved to leave the park. Those are all the things Hendricks could potentially let happen all too often in 2016 for this scenario to become a reality.
Jon Lester
90th percentile: 220 IP, 168 H, 48 BB, 223 K, 19 HR, .262 BABIP, .098 WHIP, 2.47 ERA, 2.79 DRA, 5.7 WARP
What has to go right?
This is ambitious as far as innings go, considering that Lester has only pitched 220 innings once in his career (2014), and in that he actually only pitched 219 2/3 … if we’re being particular. This scenario has Lester pitching more innings than a 90th percentile Jake Arrieta, which is certainly quite interesting. It seems as though Arrieta will be treated like a fine piece of china in 2016, but Lester is used to being a workhorse, so in that context this isn’t an entirely unbelievable outcome. What’s fascinating to me is that PECOTA has Jon Lester pitching to almost exactly what he actually pitched in 2014, posting nearly the same amount of strikeouts over the same amount of innings, with the same ERA. Less strikeouts, more hits and less innings were the main offender of Lester’s “poor” season in 2015, which PECOTA sees him rectifying quite well in 2016. Of course we’re all thinking that if Lester could achieve exceptional success just a year prior to last, it surely isn’t out of reach for him to achieve it again—but not so fast. The Cubs signed Lester in the offseason of 2014 when he was coming off one of his career best years, so expecting him to continue producing at that level would seem natural, but let’s not forget, last year may have had it’s colossal ups and downs, but it wasn’t that far off from his career averages. 2014 was simply a magnificent campaign, but not entirely what we should expect.
10th percentile: 186 IP, 186 H, 53 BB, 189 K, 21 HR, .317 BABIP, 1.29 WHIP, 4.11 ERA, 4.59 DRA, 1.1 WARP
What could go wrong?
With the disparity of innings between the two percentiles, the type of workload Lester typically takes on, and his age (he isn’t “old” but he surely isn’t a spring chicken anymore), health is most certainly one of the top concerns. What is slightly concerning in both percentiles is that no matter what, even at his best, Lester will be giving up more home runs. Remember, he was exceptionally good at keeping the ball in the yard last season, but in his career he has been prone to a few more long balls than your average ace. Allowing around one hit per inning surely can’t make Cubs fans all that confident either, especially with these high walk total and BABIP. This could potentially turn all those hits into runs, leading up to the ERA over four. Then again remember; this is the worst case scenario.
John Lackey
90th percentile: 211 IP, 176 H, 49 BB, 183 K, 22 HR, .261 BABIP, 1.06 WHIP, 3.00 ERA, 3.37 DRA, 4.0 WARP
What has to go right?
Much as with Jon Lester last year, the Cubs are signing John Lackey coming off his career best season. The numbers that Lackey posted are definitely attractive, but we must remember that they are not averages. This was a stellar year for Lackey, it could even become an outlier. Lackey hasn’t posted a WARP close to 4.0 since 2007, and with that being said, PECOTA’s 90th percentile for Lackey seems optimistic. Lackey will have to lower his hits to a much more comfortable 7.5 per nine for these projections to come to fruition. That seems a bit unrealistic as Lackey has never allowed less than an 8.4 H/9 in his career. The home runs will still be a problematic factor, as Lackey has struggled with his fastball command since returning from Tommy John, giving up a good portion of his long balls on the pitch. Overall, Lackey will certainly be a sufficient fourth starter, but I don’t know that he’ll be this good.
10th percentile: 177 IP, 192 H, 53 BB, 153 K, 24 HR, .316 BABIP, 1.39 WHIP, 4.71 ERA, 5.24 DRA, -0.3 WARP
What could go wrong?
A lot of contact. A lot of walks. Even more home runs. All over a lot less innings. The higher BABIP will indicate that he is having troubles with the fastball, and surrendering quite a bit of contact with it, and the walks indicate that perhaps his slider isn’t inducing whiffs at a rate comparable to his 2015 zone map:
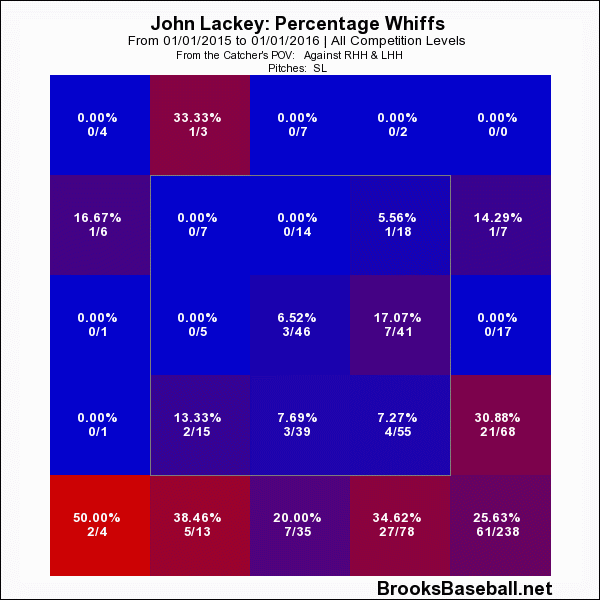
The 7.5 H/9 that these projections infer is troubling, even for a 4th starter. Overall, this is a pretty ugly outcome for Lackey, but then again, he comes on a bit of a gamble in the final stages of his career.
Adam Warren
90th percentile: 101.9 IP, 82 H, 29 BB, 86 K, 9 HR, .258 BABIP, 1.10 WHIP, 3.03 ERA, 3.14 DRA, 2.0 WARP
What has to go right?
First things first, Warren will have to stick as a starter for the 10 games that PECOTA has him penciled in to start for these projections to work. Of course, if he ends up being as good as these numbers project, he will most certainly be worthy of a starting role. These projections show Warren producing just one fewer home run than he did over 30 more innings pitched at Yankee Stadium in 2015, probably due to the fact that despite the park factors ratings, my eyes show me that left field is shallower at Wrigley Field than at Yankee Stadium, and center field is eight feet closer. Right field is a different story. The ability for Warren to lower his BABIP to an unprecedented .258 is possible considering the Cubs have one of the best defenses in the National League right now, however I’m not sure it’s entirely believable. Moving to the NL should provide a boost to Warren’s numbers though, making this scenario a bit more plausible, although if he’s pitching in late inning situations I wouldn’t expect him to be seeing too many pitchers batting.
10th percentile: 68.9 IP, 80 H, 28 BB, 58 K, 9 HR, .332 BABIP, 1.57 WHIP, 4.99 ERA, 5.20 DRA, -0.1 WARP
What could go wrong?
These numbers most certainly correspond to the scenario in which Warren is pitching almost exclusively out of the bullpen, and quite poorly, might I add. And that’s probably why he’ll have ended up there. This scenario involves a scorching amount of contact, indicating command issues, with nearly the same amount of walks as his 90th percentile projections as well as less strikeouts, both indicating control issues. Overall this scenario is a mess, and let’s hope that it ends up as unlikely as the projections claim for it to be—or else the Cubs just traded Starlin Castro and didn’t obtain solid rotational depth or a good long reliever.
Lead photo courtesy Rick Scuteri—USA Today Sports.