At the end of the 2015 season, I decided to take a crack at quantifying how lucky the 2015 Cubs had been. The season had been a pleasantly unexpected surprise, and I had a hunch that luck had played a role. After all, the team had so many close, thrilling games that ended in their favor. That couldn’t be sustainable, right?
When I ran the numbers, I discovered that the Cubs had indeed been very lucky. In fact, they were the third-luckiest team in baseball, according to my metrics.
When the podcast crew decided to drop some win predictions before the 2016 season started, I kept thinking about that piece, and I predicted the Cubs would win 94 games. Sure, they were probably going to be a smidgen more talented, but there’d also be some regression—I felt those two would cancel each other out.
Then I assumed the Cubs wouldn’t be as lucky as they were last year, and that’s how I came up with my number.
I’ll be totally honest: that piece was one of my favorite pieces I’ve ever written. And while I love all my children equally, I think about it often.
Today I’d like to go back to that work and check in on how lucky the team has been this year. Best team in baseball, right? Gotta be getting somewhat lucky, right?
Let’s dig into each of the categories in my homegrown metric and see how the Cubs are doing.
One Run Games and Extra Inning Games
The 2015 Cubs were near the top of the leader board in close games. This time around, the Cubs are pretty average. They’re right around the .500 mark on both counts, so there’s really nothing here that makes their gaudy win total unsustainable. After all, this is the same team whose Pythagorean record indicates they’re under performing.
Go figure.
Cluster Luck
In case you’re not familiar with cluster luck, here’s a quick primer from my previous piece:
Ben Lindbergh shed some light in his piece on cluster luck over at Grantland (RIP). Cluster luck tries to measure how lucky a team was by taking context out of the equation. If a guy pitches one inning and allows a walk, a single, and a then home run, then that’s a pretty bad inning, right? But if he allows a home run, then a walk, then a single, and then strikes out the side—that’s looks like a much better outing than the first.
Despite allowing the same base stats (a home run, a single, and a walk), cluster luck takes the sequence of events into account. And the Cardinals led the league in cluster luck (according to BaseRuns). If you’re new to cluster luck and are still a little confused on how it works, check out this piece.
The Cubs currently stand at -2, which indicates they’ve been unlucky when it comes to things like sequencing. Not super unlucky, but they haven’t really gotten a ton of breaks either.
Which is interesting to note because the numbers the starting rotation is posting right now are pretty ridiculous. You would expect there to be some luck involved. According to the data set, that’s not quite right.
Interesting.
Health
Let’s get the big elephant in the room out of the way: Kyle Schwarber. That injury alone should put the Cubs pretty deep on the “bad luck” spectrum, right? Well, the way I’m quantifying this in this exercise is by using a metric from Mangameslost.com called Lost WAR. And the way they calculate it is by taking a player’s current WAR at the time of the injury and then trying to extrapolate how much was lost (or gained, if the player was really bad) when the injury took them out of commission.
The problem for the Cubs is that, at the time of his injury (through only two games), Schwarber had a negative WAR. Which is unfair since he’d barely played, but that’s the way this luck metric is calculated. It isn’t perfect, since it’s saying the Cubs actually came out ahead when Schwarber landed on the DL.
Which is downright blasphemous.
As the season moves along, this number may start to correct itself, but the anomalies of players like Schwarber is going to screw with the numbers.
That’s why the Cubs placing near the top of this particular leaderboard feels a little weird. When the Cubs lost Schwarber, there’s no way you can make the argument this team got better.
The Numbers
OK, it’s time to show you which teams have had the most luck in 2016 so far. Luckiest teams are on the left and unluckiest are on the right.
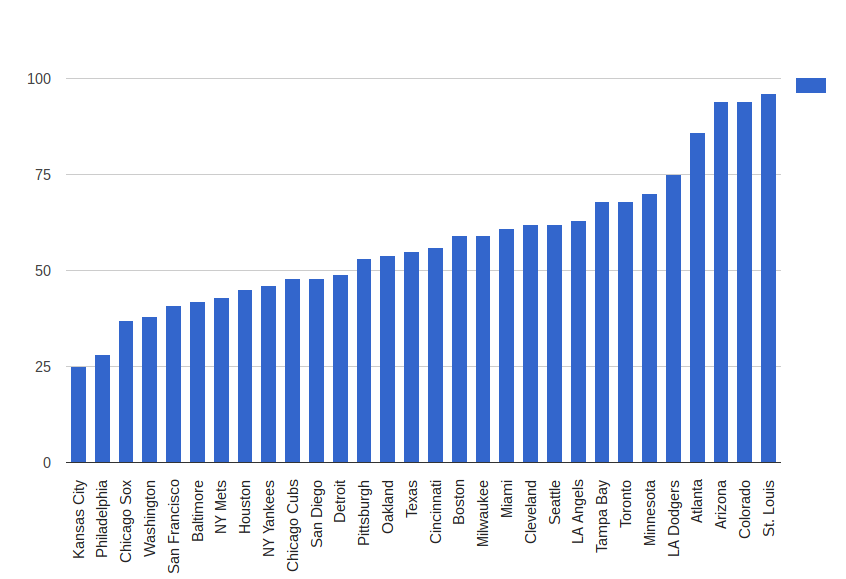
What you see up there is deceiving: the Cubs were pretty average when it comes to luck but that lost WAR metric pushed them towards the left quite a bit. Curious to see the full breakdown? Here’s how they ranked in each category:
| Injuries | Extra Innings | One Run | Cluster Luck (FG) | Overall Luck Score | ||||||
| WAR Lost | Rank | Win% | Rank | Win % | Rank | `+/- | Rank | |||
| Arizona | 8.15 | 29 | 0.400 | 20 | 0.429 | 20 | -4 | 25 | Arizona | 94 |
| Atlanta | 1.97 | 21 | 0.364 | 22 | 0.333 | 27 | -1 | 16 | Atlanta | 86 |
| Baltimore | 0.74 | 12 | 0.500 | 13 | 0.500 | 11 | 3 | 6 | Baltimore | 42 |
| Boston | -5.95 | 1 | 0.571 | 10 | 0.400 | 22 | -5 | 26 | Boston | 59 |
| Chicago Cubs | -2.85 | 2 | 0.500 | 13 | 0.474 | 14 | -2 | 19 | Chicago Cubs | 48 |
| Chicago Sox | 0.59 | 10 | 0.714 | 3 | 0.458 | 15 | 2 | 9 | Chicago Sox | 37 |
| Cincinnati | 0.77 | 13 | 0.333 | 23 | 0.444 | 17 | 5 | 3 | Cincinnati | 56 |
| Cleveland | 4.05 | 27 | 0.500 | 13 | 0.522 | 10 | 0 | 12 | Cleveland | 62 |
| Colorado | 2.15 | 22 | 0.000 | 27 | 0.385 | 26 | -2 | 19 | Colorado | 94 |
| Detroit | 0.6 | 11 | 0.600 | 8 | 0.500 | 11 | -2 | 19 | Detroit | 49 |
| Houston | 0.49 | 8 | 0.636 | 6 | 0.458 | 15 | -1 | 16 | Houston | 45 |
| Kansas City | 1.08 | 14 | 1.000 | 1 | 0.632 | 5 | 4 | 5 | Kansas City | 25 |
| LA Angels | 1.21 | 18 | 0.000 | 27 | 0.571 | 8 | 1 | 10 | LA Angels | 63 |
| LA Dodgers | 3.95 | 26 | 0.625 | 7 | 0.435 | 19 | -3 | 23 | LA Dodgers | 75 |
| Miami | 1.34 | 19 | 0.250 | 26 | 0.647 | 4 | 0 | 12 | Miami | 61 |
| Milwaukee | 1.19 | 17 | 0.333 | 23 | 0.478 | 13 | 3 | 6 | Milwaukee | 59 |
| Minnesota | -1.47 | 4 | 0.500 | 13 | 0.333 | 27 | -5 | 26 | Minnesota | 70 |
| NY Mets | -0.5 | 5 | 0.500 | 13 | 0.609 | 6 | -2 | 19 | NY Mets | 43 |
| NY Yankees | -0.49 | 6 | 0.000 | 27 | 0.600 | 7 | 3 | 6 | NY Yankees | 46 |
| Oakland | 1.17 | 16 | 0.667 | 4 | 0.400 | 22 | 0 | 12 | Oakland | 54 |
| Philadelphia | 2.41 | 23 | 1.000 | 1 | 0.714 | 2 | 7 | 2 | Philadelphia | 28 |
| Pittsburgh | 1.15 | 15 | 0.429 | 19 | 0.526 | 9 | 1 | 10 | Pittsburgh | 53 |
| San Diego | -2.39 | 3 | 0.600 | 8 | 0.391 | 25 | 0 | 12 | San Diego | 48 |
| San Francisco | 2.44 | 24 | 0.556 | 11 | 0.667 | 3 | 5 | 3 | San Francisco | 41 |
| Seattle | 0.44 | 7 | 0.556 | 11 | 0.417 | 21 | -3 | 23 | Seattle | 62 |
| St. Louis | 3.76 | 25 | 0.500 | 13 | 0.313 | 29 | -8 | 29 | St. Louis | 96 |
| Tampa Bay | 1.86 | 20 | 0.667 | 4 | 0.438 | 18 | -5 | 26 | Tampa Bay | 68 |
| Texas | 5.78 | 28 | 0.286 | 25 | 0.810 | 1 | 8 | 1 | Texas | 55 |
| Toronto | 0.55 | 9 | 0.375 | 21 | 0.400 | 22 | -1 | 16 | Toronto | 68 |
| Washington | -0.58 | 5 | 0.600 | 8 | 0.611 | 6 | -2 | 19 | Washington | 38 |
This was not what I expected to find. The much-discussed underperformance hinted at by the Cubs’ Pythagorean record is one thing that might have tipped me off. But this team has been mostly dominant this season, so the pessimist in me kept waiting to find something, anything, that would explain how good this team has been and point to an inevitable correction. I guess I’ll just have to keep looking.
In a sense, this isn’t surprising: the ways we measure luck are mostly distal to the thing itself—we look at one-run games, or injuries, or clustered events, and call that luck. That works in most cases—the big lump of teams in the middle of the pack—but it doesn’t work particularly well when you have a team that’s either especially good (like the Cubs, this year) or especially bad (think the Phillies or the Braves). These teams simply don’t play as many one-run games as others, and aren’t as reliant on so-called “cluster-luck” to score or not score. They are, therefore, difficult to pin down, when it comes to luck. In short, then, the 2015 Cubs were luckier than most, but they were also in a better position than most to get lucky. The 2016 Cubs, meanwhile, have just been flat-out good. Little luck has been necessary.
Lead photo courtesy Caylor Arnold—USA Today Sports.
Silly for mangameslost not to use a 162 game rolling average WAR instead of one that starts only with the current season. That seems like a really simple oversight to fix.