It’s been thirteen years since Moneyball was published and the term “sabermetrics” was added to the public vernacular. While Moneyball itself was not the cause of the modern baseball analytical revolution that began in the late 1990’s and continues today, it’s undeniable that it’s popularity and platform allowed for the ideas of the sabermetric community to reach beyond the faithful consumers of BP annuals and Bill James Abstracts and become mainstream. While the ideas set forth by Billy Beane, Paul DePodesta, and Co. in Moneyball were at the time unique, the statistics like on-base percentage that they were derived from weren’t actually new; they were just being looked at through a different lens and given more credence over fundamentally flawed traditional statistics. The exception to this was the idea and subsequent creation of defensive independent pitching statistics (DIPS).
DIPS were discussed in Moneyball to explain the success of Chad Bradford and had been previously explained by their creator Voros McCraken on BP in 2001. In short, McCraken discovered that pitchers, no matter the inherent talent level, had little to no control over ball once it was put in play (besides home runs). As such, instead of just looking at traditional pitching statistics like earned run average (ERA) McCracken argued that the most accurate assessment of a pitcher’s performance that year (and going forward) came from his results in the three true outcomes: walks, strikeouts, and home runs. This simple idea fundamentally changed how pitchers were evaluated and led to creation of batting average on ball in play (BABIP), and eventually the fielding independent pitching metric (FIP). All of this is probably common knowledge to the readers on this site, but it helps to refresh on the fundamentals of these statistics, know where they came from, and understand each statistics weaknesses and strengths. This is particularly vital when trying to evaluate for the 2016 Cubs pitching staff, who have been historically good in ways that make them look like extreme outliers. Overall, the 2016 Cubs have a FIP of 3.82 vs. an ERA of 3.12; this 0.7 net positive difference is more than the next two teams (Cincinnati and Kansas City) combined. The Cubs pitching success in 2016 proves something’s happening that we aren’t able to measure using the McCracken’s DIPS ideas. And in no Cubs pitcher is that more apparent than in Jon Lester.
Despite his status as the highest paid rotation member and the signature free agent acquisition on this Cubs team (Sorry Jason Heyward), it feels like Jon Lester is often overlooked. This isn’t his fault, as his performance has definitely lived up to hype; since his arrival prior to the 2015 season Lester has accumulated 8.8 WARP. But with Jake Arrieta reaching supernova status in the second half last year, Kyle Hendricks reaching unexpected stardom status status this year, and John Lackey saying John Lackey things, the day’s talking points rarely seem to mention Lester. And that’s a shame because this year Lester has improved on his solid 2015 performance in a manner that is unlike any of his previous success. Below I’ve listed out Lester’s career numbers.
|
Year |
Team | IP | K% | BB% | BABIP | TAv | FIP | ERA | WARP | FIP – ERA |
| 2006 | BOS | 81.3 | 16.40% | 11.70% | 0.333 | 0.275 | 4.60 | 4.76 | 0.4 | -0.16 |
| 2007 | BOS | 63 | 18.20% | 11.30% | 0.279 | 0.265 | 5.31 | 4.57 | -0.8 | 0.74 |
| 2008 | BOS | 210.3 | 17.40% | 7.60% | 0.297 | 0.234 | 3.67 | 3.21 | 4.5 | 0.46 |
| 2009 | BOS | 203.3 | 26.70% | 7.60% | 0.313 | 0.227 | 3.20 | 3.41 | 7.8 | -0.21 |
| 2010 | BOS | 208 | 26.10% | 9.60% | 0.289 | 0.220 | 3.10 | 3.25 | 6.6 | -0.15 |
| 2011 | BOS | 191.7 | 22.80% | 9.40% | 0.286 | 0.242 | 3.86 | 3.47 | 4.9 | 0.39 |
| 2012 | BOS | 205.3 | 19.00% | 7.80% | 0.312 | 0.266 | 4.06 | 4.82 | 4.3 | -0.76 |
| 2013 | BOS | 213.3 | 19.60% | 7.40% | 0.300 | 0.259 | 3.61 | 3.75 | 3.4 | -0.14 |
| 2014 | BOS/OAK | 219.7 | 24.90% | 5.40% | 0.299 | 0.238 | 2.83 | 2.46 | 6.6 | 0.37 |
| 2015 | CHN | 205 | 25.00% | 5.70% | 0.304 | 0.242 | 2.95 | 3.34 | 5.4 | -0.39 |
| 2016 | CHN | 160 | 25.20% | 7.10% | 0.262 | 0.232 | 3.65 | 2.7 | 3.4 | 0.95 |
Two things jump out from Lester’s 2016 line: the career low BABIP of 0.262, and the career high difference between FIP and ERA of +0.95 (FIP>ERA). Lester’s other peripherals like strikeout rate and walk rate have remained relatively consistent, but the BABIP and FIP differences are not similar to any of Lester’s prior years as a full time starter. Using just the three true outcomes logic (i.e. walks, strikeouts, home runs) you could argue that Lester has been the recipient of some good luck in 2016; but this line of thinking is selling Lester short. Watching Lester day in and day out like many of us have know that it takes skill, not luck to get these results. And since it’s 2016 we can dig into the publicly availably Statcast data to prove it.
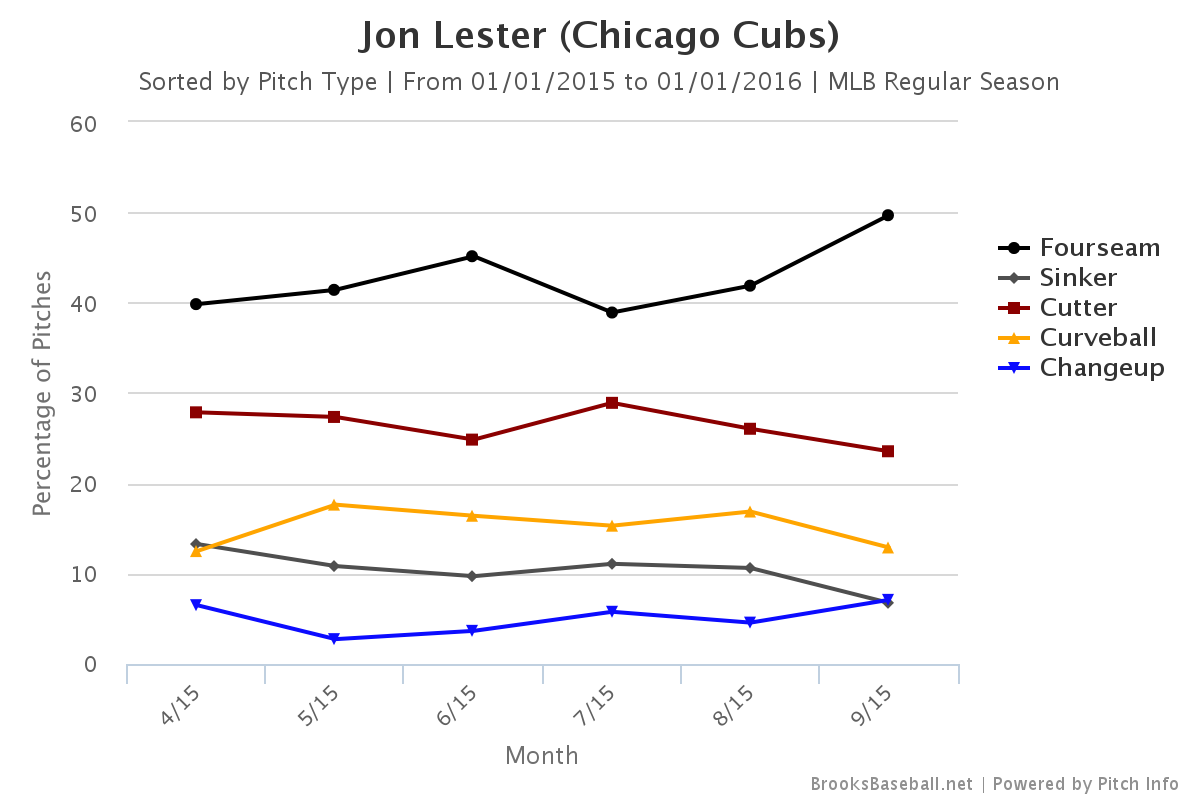
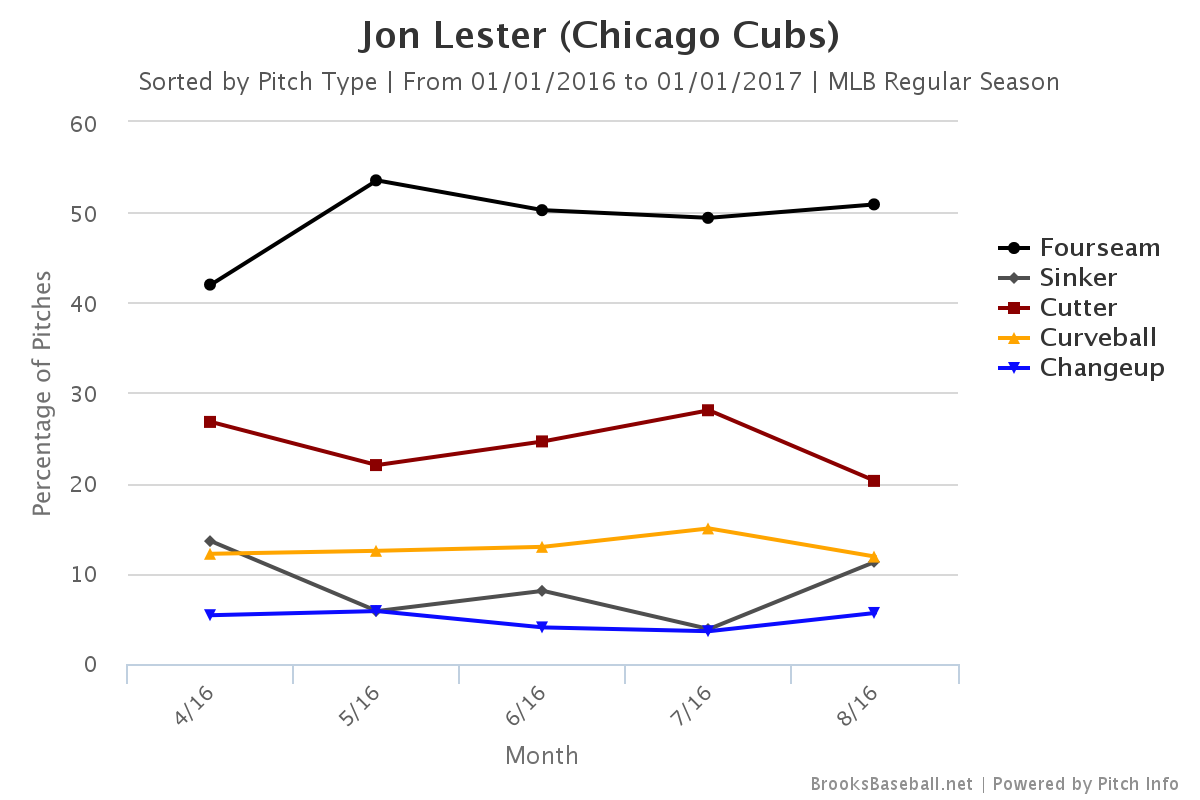
Before we get into the Statcast data it’s helpful to know Lester’s pitch breakout between 2015 vs. 2016. As seen above, whereas in 2015 Lester tried to mix in his curveball earlier in the year before ramping up his four seam fastball usage, in 2016 he’s been full bore with the four seamer from the get go. The results from his four seam fastball (which were also touched upon in a previous BP Wrigleyville article) below show why:
| Year | Velocity | Whiff Rate | Swing Rate |
| 2015 | 92.84 | 5.74 | 37.21 |
| 2016 | 93.19 | 6.88 | 41.76 |
Everything’s up and and that’s good news because Lester’s four seam success ripples throughout his arsenal and makes his secondary pitches that much better. This applies specifically to Lester’s signature pitch: his cut fastball/cutter. See below for the Statcast breakouts for 2015 and 2016.
2015 Statcast Breakout
| Pitch Type | Lester – Avg. EV (mph) | Lester – Avg. LA (degrees) | MLB – Avg. EV (mph) | MLB – Avg. LA (degrees) | BIP % |
| Change | 79.00 | -1.19 | 86.17 | 8.77 | 4.6% |
| Curve | 87.08 | 21.36 | 86.81 | 9.32 | 15.4% |
| Cutter | 85.01 | 14.98 | 87.04 | 11.12 | 22.8% |
| Four Seam | 87.18 | 13.98 | 89.95 | 14.42 | 46.1% |
| Sinker | 94.09 | -3.48 | 90.10 | 6.56 | 11.1% |
2016 Statcast Breakout
| Pitch Type | Lester – Avg. EV (mph) | Lester – Avg. LA (degrees) | MLB – Avg. EV (mph) | MLB – Avg. LA (degrees) | BIP % |
| Change | 87.28 | 6.37 | 86.82 | 9.35 | 4.6% |
| Curve | 84.60 | 15.53 | 87.25 | 10.57 | 8.5% |
| Cutter | 85.94 | 9.05 | 87.72 | 11.44 | 24.5% |
| Four Seam | 89.67 | 15.93 | 90.55 | 15.07 | 49.3% |
| Sinker | 92.20 | 8.78 | 90.44 | 6.73 | 13.1% |
From 2015 to 2016 the average launch angle for Jon Lester’s cutter went from 14.98 degrees to 9.05 degrees, a whopping decrease of almost 40 percent. Essentially this means that in 2015 a few line drives snuck in against Lester’s cutter, but in 2016 Lester slammed that door shut by forcing hitters to pound his offerings into the ground. I’ve plotted the location of Lester’s cut fastballs hit in play for both 2015 and 2016 below as a visual reference.
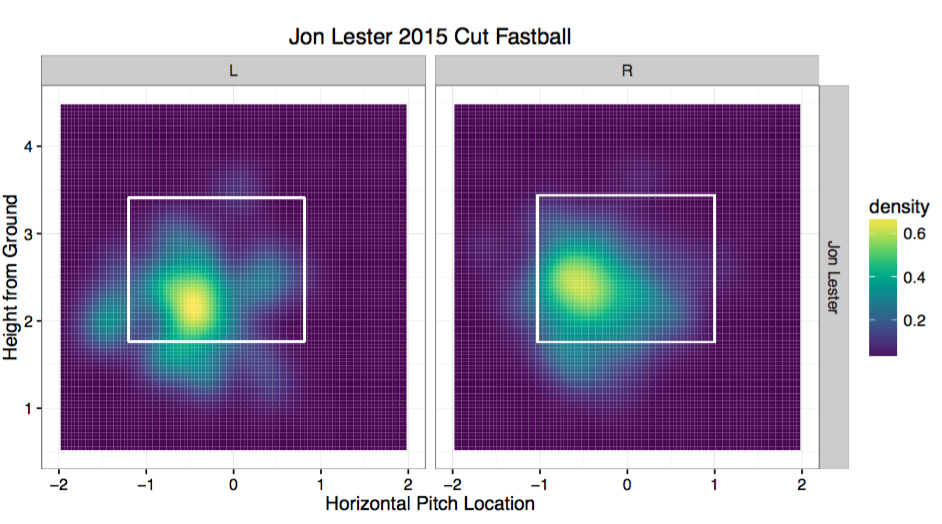
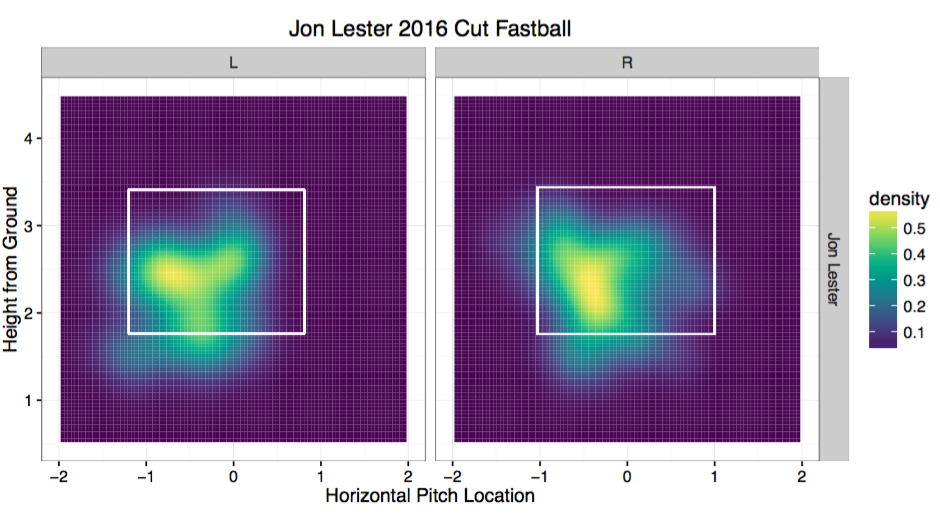
Notice how Lester shifts his approach in 2016 by elevating his cutter away against left handed hitters and inside against right handed hitters. By consistently executing this Lester makes it that much harder for hitters to get under his cutter, which more often than not in 2016 has lead to weak contact on the ground. In doing so Lester is suppressing his BABIP through his own ability and skill, not just by sheer luck. Granted his fielders still have to convert these grounders into outs, but Lester deserves credit for making adjustments in 2016 that have made him a better pitcher, even if that’s not clear by just looking at his FIP.
All of that being said it’s impossible to write an article about 2016 Cubs pitching success without giving the necessary credit to the defense. By any conceivable metrics the 2016 Cubs have one of the best defenses in the past twenty five years. Not only are the Cubs are nearly two and half times the next closest competitor (Blue Jays) in Park Adjusted Defensive Efficiency (PADE), they are on pace to shatter the all time mark for PADE (2001 Seattle Mariners) by over a full point. If that’s not your preferred advanced defensive metric, the Cubs also lead the league in UZR by nearly 14 points over the Royals. And if you don’t trust advanced defensive metrics at all consider the following points:
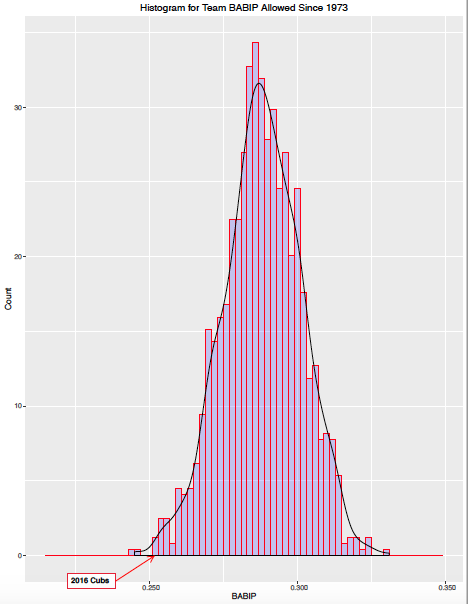
- Only eight teams since 1973 (the implementation of the designated hitter in the AL) have allowed a lower BABIP than the 2016 Cubs. The last time a team finished a season with a lower allowed BABIP than 2016 Cubs was 1982.
- Since 1973 only two teams have had a greater positive difference between ERA vs. FIP (ERA < FIP) than the 2016 Cubs.
- Relative to league average BABIP, the 2016 Cubs have allowed a BABIP 42 percentage points lower. No team since 1973 has reached this mark.
Since points like this can seem like hyperbole and eventually become monotonous, I’ve also included visuals for further support. Below I’ve plotted each teams allowed BABIP since 1973 as a distribution, I’ve included a box and arrow to help you find the 2016 Cubs.
Even when you include the Statcast data the Cubs defense still stands out. Below I’ve plotted each team’s average exit velocity vs. its BABIP allowed in 2016.

While exit velocity by itself does not guarantee hits without the proper launch angle, it can still serve as a decent barometer for the BABIP for an entire pitching staff. The 2016 Cubs literally almost fall off the map, so much so that I re-did this analysis three times because I thought I had mistakingly forgotten to include them as I didn’t see them at bottom. At this point without any substantial defensive Statcast data available we’re left with guesses (i.e. quick first steps, perfect route efficiency, etc.) as to how to quantify the 2016 Cubs defensive greatness. And you know what, that’s fine by me, just as long as we get an encore of this play later this season.
To be clear, I’m not the first person to notice the Cubs defensive outlier status, as each of the linked articles above mention the Cubs absurd allowed BABIP. But these articles were written early in the Summer while there was still time for a regression to kick in; if you’ve been watching the Cubs at all this year you know that there hasn’t been much of a regression of anything, especially on defense. There’s a lot of reasons why the Cubs defense is performing at such an esteemed level: a full year of Addison Russell at shortstop, a full year of Jason Heyward in right field, a new and improved Dexter Fowler in center field. To me the biggest reason the defense has reached such heights was that the Cub’s two most shaky defensive players (Jorge Soler and Kyle Schwarber) have missed significant time in the 2016 season. More importantly the absence of these two 2015 Playoff heroes opened the door to Kris Bryant in left field, and Javy Baez at third base on a consistency basis. To be fair I’m not picking on Schwarber and Soler, I think both of them could have improved upon their 2015 performance to become serviceable fielders. But there’s no doubt that Baez presence, no matter where he is positioned on the diamond, has taken the Cubs defense to a different level. With their entire “closing” infield of Bryant, Russell, Baez, and Rizzo locked up long term, and Heyward patrolling in right, expect more BABIP anomalies for the Cubs in the future. And that fact has to make Jon Lester smile, even as he loses his personal catcher to retirement.
Lead photo courtesy Gary A. Vazquez—USA Today Sports.
This is a fantastic piece, well done.
I’d be interested to see some of those plots for the 2014 and 2015 Royals. I consider those Royals teams to be the best recent defensive teams, and the 2015/2016 Cubs have grabbed that title, but I believe the Royals were excellent BABIP supressors, too, and their rotation were the benefactors.
Thanks for the kind words. I agree about the Royals defense being the standard prior to this year; possibly in a later piece I’ll compare them to Cubs in greater detail.
It’ll be interesting to see what lineups Maddon comes up with in the playoffs. Max defense? Baez has 14 DRS so far (actually 13, he has -1 for his limited play at 1B), Russell 17, Zobrist 1, Fowler is really just less bad defensively with 2 DRS. Almora had 4 DRS in his limited play in CF. Impressive.
zobrist is actually +1 overall, and -3 at 2B where Baez would most likely play.
Valid points, especially about Almora. Just can’t see Maddon taking Fowler’s bat out of the lineup for him though. Possible max defense lineup with that in mind could be Almora in LF, with Bryant staying at 3B, and Baez going in at 2B for Zobrist. Even then I’m not sure Maddon wants that much youth/non-contact hitters in a playoff lineup.
Zobrist is definitely going to play somewhere, so the max D lineup isn’t going to happen. But it’s worth trying to guess the impact of having that much run suppression versus a better offensive lineup that would still be very good defensively.