
Last week, Baseball Prospectus introduced some exciting new ways to evaluate pitching, one of which focuses on the notion of pitch tunnels. As that piece explains, this is essentially an attempt to quantify what Greg Maddux called the ‘column of milk'; the concept that an arsenal is extremely effective when the pitches are virtually indistinguishable from each other, most crucially at the point when batters need to decide whether to swing. Yesterday, Kenny Kelly wrote about the closest thing we have to a present-day Maddux, Kyle Hendricks. Today, I’ll be evaluating Jon Lester in the light of the new metrics.
There are three key points in pitch trajectories that the metrics focus on: the release point; the ‘tunnel point'; and the plate itself. Two of those will be familiar to everyone. The tunnel point is the point at which a hitter needs to decide whether to swing or not, which (based on a league-average fastball) is 175 milliseconds before contact, or in distance terms, 23.8 feet. Flight time differential is also calculated, to show the range of speeds between pitches.
Lester is mentioned in the original explanatory piece because he’s particularly notable in two aspects of these statistics: he has an incredibly consistent release point, and there is not a great deal of differentiation between his pitches at the tunnel point. In other words, his pitches generally look like they’re coming from the same place, and they’re not much further apart when they reach the point at which the hitter has to make a decision about swinging.
To illustrate this in quantitative terms, here are some specifics from that original piece. Lester’s average release point varies by 1.2 inches, the best in the league (the average is 2.4 inches). His pitches are, on average, 9.8 inches apart at the tunnel point, just under the league average of 10 inches. This gives him the league-leading release:tunnel ratio of 13.6%.
This might give some idea of how it’s difficult to face Lester, or play baseball in general, or it might simply not sound that impressive. After all, 9.8 inches sounds like a lot. It’s more appropriate to think in terms of visual angle.* If you were to draw a line from the top and the bottom of an object and have them meet at your eye, the visual angle is the angle created between the two lines. This can then be used to determine the size of the actual image created on the retina, which more accurately reflects the perceived size of a stimulus, rather than its actual size.
From 60 feet, 6 inches away, a baseball’s size (assuming the baseball is 2.9 inches across) in degrees of visual angle is the same as looking at a quarter from just under 20 feet. At the tunnel point, it’s more like looking at the quarter from 8 feet. The difference in Lester’s release point of 1.2 inches represents 0.095 degrees of visual angle, the same as a quarter from 48 feet, or, if you sit two feet from your computer and look up at the ‘Wrigleyville’ text in the banner, the same width as the I. If you were looking at a 9.8 inch object from 23.8 feet, the retinal image size is then the same as the quarter from 2’4″ away, a visual angle of 1.96 degrees. That’s twenty times that of the release point differential, but still not particularly large: it compares to 0.82 inches at 2 feet, about the height of three lines on this page. Hitting a baseball is already difficult; then consider the fact that Lester is the best at one of these metrics and above-average at the other.
Digging deeper into the metrics illuminates Lester’s quality further. All pitches thrown have been split into ‘pitch pairs’ in the framework of the new stats. That allows a differential to be calculated for each individual sequence of pitches; for instance, it’s now possible to see the differentials for Lester’s changeup when he throws it after his fourseam fastball, in terms of release point, tunnel point, and where it arrives at the plate.
It shouldn’t come as a surprise to anyone that if there is a low differential in the first two of these categories, and a higher differential in the third, a hitter is more likely to be fooled, because they won’t be able to distinguish that the pitch is different, and therefore they can’t make a good decision about whether to swing at it.
The fact which jumps out from looking at the pitch tunnel pairs leaderboard is just how good Lester is at repeating his release point. The smallest release differential for any pair of pitches in 2016 (minimum 50 pairs) was two consecutive Lester cutters. The second smallest was consecutive Lester fourseamers. It is perhaps not surprising that this differential would be low for any pitcher with a consistent delivery, but Lester’s are the lowest in all of baseball.
That’s just scratching the surface of how Lester excels. The fourth smallest differential was his fourseam followed by his cutter. The reverse, cutter followed by fourseam, is twelfth. The release differential for this, the worst of the four sequences, is 1.14 inches. Look back at the width of the I. From 60 feet away, there’s no way to tell Lester’s fastball and cutter apart based on his release point.
That isn’t to say that Lester’s other pitches come from much more different points. Essentially every Lester pitch sequence that doesn’t involve a curveball is in the top 20 percent by release differential. The same unsurprisingly goes for his release:tunnel ratio across all these pairs.
His fourseam-changeup and changeup-fourseam sequences have 1.34 and 1.41 inch release differentials respectively. That’s still less than half the width of a baseball. There are just over 3,000 sequences that meet the 50 pitch minimum. Of the 15 Lester sequences that appear in that sample, 9 are in the top 10 percent for release:tunnel ratio, and most of those that aren’t involve the curveball.
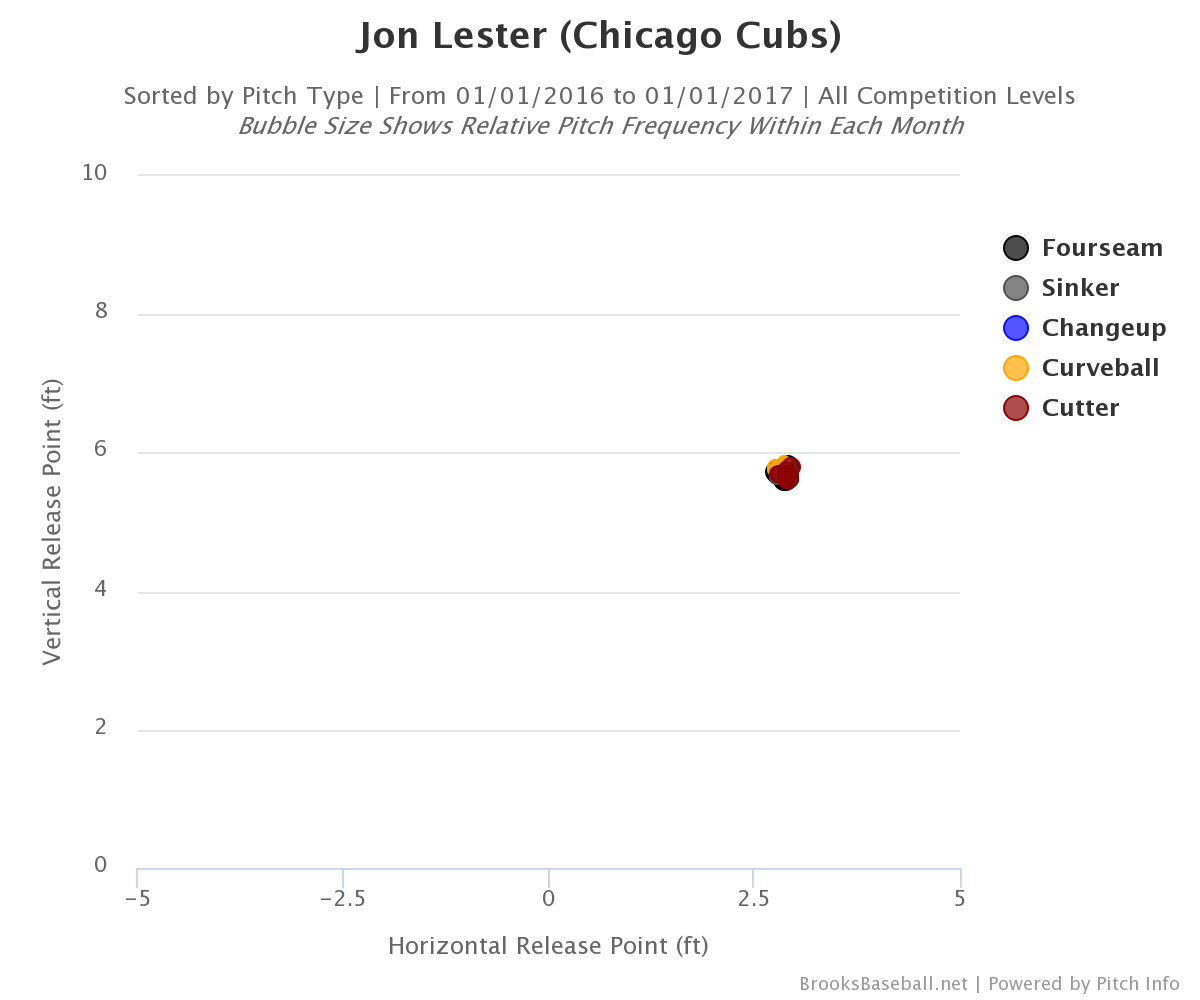
Lester isn’t making his pitches difficult to tell apart in quite the same way as Hendricks. His teammate doesn’t have the same release point consistency, but his pitches also don’t move as much, meaning they have a narrower tunnel differential. Lester’s arsenal starts out clustered so tightly that while his pitches separate more, they’re still close enough to deceive the hitter. Here’s another illustration of just how tightly clustered those release points are:
Lester doesn’t have a huge flight time differential between his four faster pitches, with between 7 and 8 mph separating the fourseam from the change. That might actually help with the deception; there are very few extra milliseconds to tip a hitter off about which kind of pitch they’re getting. There are 14-15 milliseconds separating the fastball and cutter on average which – even compared to the 175 milliseconds the hitter has before they need to decide to swing – is not very much time. In a follow-up piece examining Hendricks in the light of the new data, Jeff Long, Jonathan Judge and Harry Pavlidis built a model that “suggests that smaller flight time differences are better in terms of driving swings and misses”. That makes sense from a deception standpoint; it’s also an approach embodied by Lester’s pitch mix.
Mapping the trajectories of Lester’s arsenal also gives some idea of what it’s like to face the left-hander. The below Pitch F/X virtualizations from TexasLeaguers.com provide an overview of the flight of his pitches, both from the side and above.
This is a somewhat crude way of looking at a complex issue and these shouldn’t be taken as highly accurate depictions of Lester’s pitches. However, it’s a good proxy and a neat way to illustrate the fact that at the tunnel point, just after the ball passes the 25 foot marker on these graphs, Lester’s pitches tend to be very close together. It’s not an exaggeration to call it a column at the tunnel point, where there’s no discernible gap between the pitches. There isn’t huge break after the tunnel point in most cases, but the pitches arrive at the plate far enough apart to be problematic for the hitter who misjudges a pitch, whether that’s a swinging strikeout or poor contact from selecting a bad pitch to swing at, or a called strike on a fastball that initially looked just like the cutter that was low and outside.
The statistics, new and old, bear this out. Lester’s post-tunnel break is nowhere near that of a Clayton Kershaw or Andrew Bailey, nor does it need to be. For instance, the fourseam-cutter differentials are just under 1.7 inches, more than enough for a swing and miss, weakly hit grounder or pop-up. Lester ranked 6th amongst qualified starters in hard-hit rate in 2016, 26th in ground ball rate, 27th in infield fly ball rate and 28th in swinging strike rate. There isn’t one single way that Lester deceives or beats hitters; instead, he does it with consistency and control, generating a range of positive outcomes.
The other new stats released by BP last week, based on called strikes, also show Lester in a positive light. The 33-year-old ranked ninth in Called Strikes Above Average (CSAA) in 2016, getting 1.9% more strikes than his called strike probability would suggest. As might be expected from his consistency in other areas, Lester is very good at not only working the edges of the strikezone, but also getting umpires to interpret it more liberally than they do for other hitters. During the playoffs, Jeff Sullivan highlighted a terrific example of Lester getting called strikes that he really shouldn’t be given.
There are many nuances of the new BP data that have yet to be revealed. These are complex statistics that indicate more clearly than ever that there are many different ways to succeed as a pitcher. We may not even have got close to identifying everything that makes Jon Lester successful, but we certainly have a better way to explain some of that success.
*Thanks to Harry Pavlidis and Dan Brooks of the BP Stats team for their help, including taking the time to explain that visual angle was the most appropriate way to express this comparison, while also not being entirely accurate given the way that perspective is handled in the data. I will leave it to someone with far more knowledge of the topic than me to explain why.
Lead photo courtesy Jerry Lai—USA Today Sports
“The fourth smallest differential was his fourseam followed by his cutter”
I don’t agree