Last weekend I watched from afar as Noah Syndegaard was finally placed on the disabled list, and the New York Mets organization left their fans to talk themselves off the ledge one blog post at a time. Part of me felt some sort of perverse pleasure in this; after all, the Mets are the team that caught the Cubs in 1969 and slaughtered a really fun, young Cubs team in the 2015 NLCS, a series in which the Cubs never led and were outscored by thirteen runs in just four games. But for the most part it just made me feel sad, because seeing a young, promising rotation shattered by injuries after only one year together reminded me of the early 2000’s Cubs. There’s always an inherent risk in building around younger pitchers as those Cubs teams and now the 2017 Mets have found out, but even for teams that aren’t centered around starting pitching can see their season go up in smoke if multiple starting pitchers either get injured or underperform.
And that leads us to the 2017 Cubs. If you combine the 2015 and 2016 regular season the Cubs went 200-123 (~.620 winning percentage) – the next closest team over this time frame was the Cardinals (186-138, .574 winning percentage). There are a lot of reasons for this sustained success, but this level of dominance wouldn’t have been possible without the Cubs starting pitchers absurd health over this time period. Here’s the breakout:
| Year | Opening Day Rotation | Games Started | % Games Stared | ERA | FIP | DRA |
| 2015 | Lester, Arrieta, Hammel, Wood, Hendricks | 137 | 84.6% | 3.36 | 3.32 | 3.41 |
| 2016 | Lester, Arrieta, Lackey, Hammel, Hendricks | 152 | 93.8% | 3.15 | 3.80 | 3.72 |
So while the 2016 Cubs defense may have been the secret sauce that everyone talked about after the meal, the rotation’s performance, coupled with its outstanding health, was the juicy steak that got the restaurant its five star rating and patrons into the door in the first place. Unfortunately, that stellar performance from the Cubs starting rotation has not transferred over during the first month of the 2017 season.
Here’s the 2017 Cubs starting rotation (Lester, Arrieta, Lackey, Anderson, Hendricks) ERA/FIP/DRA slash line thus far in 2017 (through 5/2/17): 3.94/4.34/5.31(!). Simply put, it hasn’t been a great start. At BP Wrigleyville, we have already touched on the potential velocity issues that the starters experienced earlier in the season, (which may or may not be the result of bad data gathering). Considering we don’t yet know definitively how the switch from Pitch f/x to Trackman has impacted the velocity metrics on a ballpark by ballpark basis, I’m not going to delve too far into them. Instead, I’m taking a look at each Cubs starters results and peripherals for the month of April 2017 to see where each of them went wrong, and how this April has compared to the past two Aprils for each of the Cubs five starting pitchers.
Jon Lester:
- April 2015: Batters Faced = 96, ERA = 6.23, FIP = 2.21, K% = 25.0%, BB% = 5.2%
- April 2016: BF = 128, ERA = 1.83, FIP = 3.35, K% = 25.8%, BB% = 5.5%
- April 2017: BF = 125 , ERA = 3.68, FIP = 3.59, K% = 20.8%, BB% = 7.2%
- Best Start -2017: 4/16 vs. Pirates
- Worst Start – 2017: 4/26 vs. Pirates
Even before looking into the numbers, the eye test was telling me that Jon Lester wasn’t missing as many bats as he had for much of his Cubs tenure. Indeed, you have to go all the way back to June 2014 to find a month where Lester had a lower strikeout rate than the 20.8 percent he had in April 2017. To compound matters, Lester’s walk rate rose above seven percent in April 2017. In hindsight, Lester’s early struggles should have been predictable as he went from having a personal catcher in David Ross who had caught him for the better part of the last four seasons to Willson Contreras, someone who has only been a catcher for six years and has less than 100 games of experience at the major league level. One thing that could be contributing to Lester’s decreased strikeout rate in 2017 is the avoidance of the inner half of the plate with his fastballs, particularly against right handed hitters. Check out Lester’s 2016 April vs. his 2017 April below.
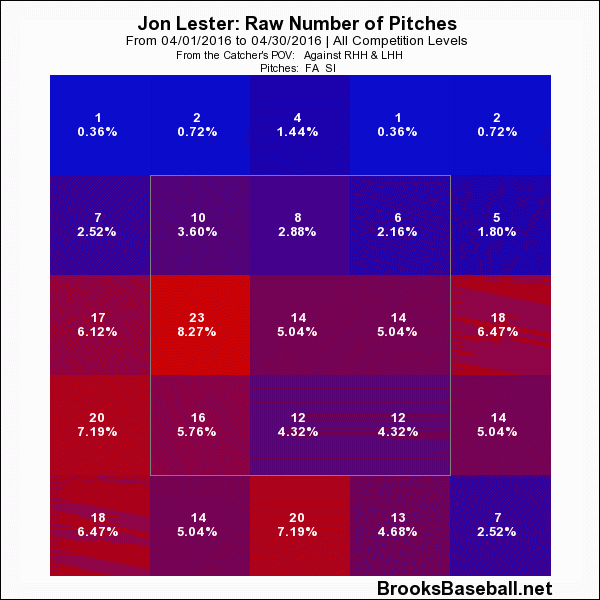
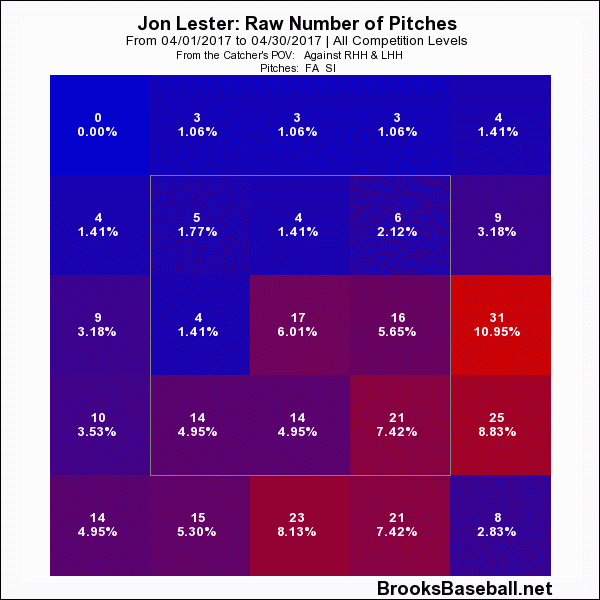
Lester has thrown roughly the same amount of two seam and four seam fastballs in April 2016 vs. April 2017, but the inside part of the plate has largely been vacated. Even if these pitches don’t result in an increase in swinging strikes, it’s imperative that Lester establish this zone if only to draw the hitters eye level away from the outer third of the plate. Once Lester gets back to doing this, expect his effectiveness against right handed hitters (who currently own a 2017 slash line of .295/.383/.505) to improve, along with his overall performance.
Jake Arrieta:
- April 2015: BF = 105, ERA = 2.03, FIP = 2.53, K% = 27.2% , BB% = 5.8%
- April 2016: BF = 129 , ERA = 1.00, FIP = 2.92 , K% = 24.8%, BB% = 7.8%
- April 2017: BF = 123 , ERA = 4.66, FIP = 4.28, K% = 27.6, BB% = 6.5%
Of all of the Cubs starters, Jake Arrieta has had perhaps the most uncharacteristic start to the 2017 season. Unlike Lester, Arrieta’s strikeout rate and walk rate so far in 2017 have each gone in the right direction, which after watching how erratic Arrieta could be from May 2016 on last year is a victory in and of itself. It has been theorized that Arrieta may have purposely sacrificed some of his velocity in the early going of 2017 in exchange for greater command of his pitches. If this is indeed the case, it has so far unfortunately been an uneven exchange. Thus far in 2017 Arrieta has given up a barrel per batted ball event rate of 6.3%; in 2016 this figure was at 4.8%, and in 2015 it was 2.2%. Obviously sample sizes have to be taken into account, but it’s pretty clear in the early going of 2017 that Arrieta has been hit harder than we are used to seeing. It’s up to Arrieta to find that happy medium between enough velocity to induce softer contact, and enough command to maintain the strike zone and limit the walks. One thing to keep in mind going forward with Arrieta is whether or not his increased use of offspeed and breaking pitches (particularly favoring his curve ball over his slider) in 2017 compared to the prior season will continue.
Kyle Hendricks:
- April 2015: BF = 87, ERA = 5.23, FIP = 3.28, K% = 21.8%, BB% = 4.6%
- April 2016: BF = 92, ERA = 3.91, FIP = 2.58, K% = 20.7%, BB% = 4.4%
- April 2017: BF = 114 , ERA = 4.18, FIP = 5.04, K% = 19.3%, BB% = 10.5%
National media talks about Kyle Hendricks as a ground ball pitcher, but that only tells part of the story. For Hendricks, success primarily depends on the performance of his sinker vs. his change up. Ideally, Hendricks would have approximately an eight mph difference between these two pitches to induce a number of swing and misses and maintain his deceptively high strikeout rate. This hasn’t been the case so far for Hendricks in 2017 as his fastballs have struggled to reach 86 mph after topping out at 89 in the 2016 playoffs. This directly affects Hendricks’ strikeout and walk rate, both of which are below previous April marks, and well below his stellar 2016 season metrics. Without the velocity discrepancy, hitters simply won’t be fooled by Hendricks’ changeup like they were in 2016. Below are the pitch outcomes for Hendricks thus far in 2017 compared to 2016:
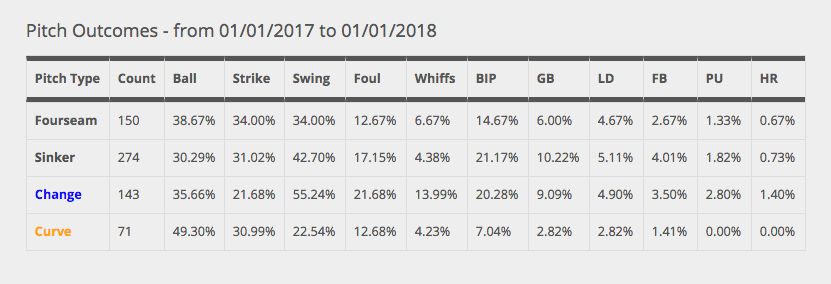
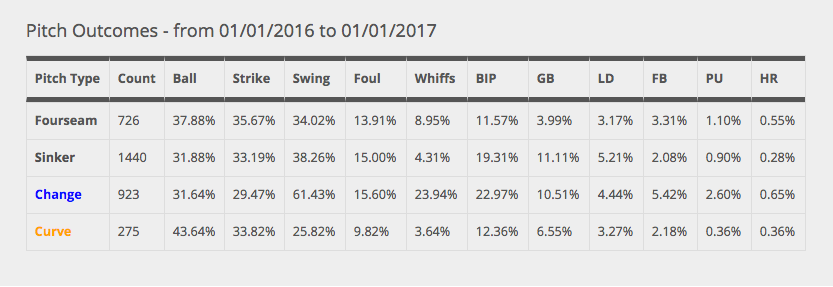
The decrease in Hendrick’s whiffs on his changeup from 2016 compared to 2017 is disconcerting to say the least. Hopefully Hendrick’s recent mechanical adjustment can change this and get him back on the Cy Young track.
John Lackey:
- April 2015: BF = 107 , ERA = 4.21, FIP = 3.64, K% = 13.1%, BB% = 4.7%
- April 2016: BF = 102, ERA = 4.97, FIP = 3.26, K% = 26.5%, BB% = 5.9%
- April 2017: BF = 130 , ERA = 5.10, FIP = 4.94, K% = 23.1%, BB% = 6.9%
At this point in his career John Lackey is what he is; he relies heavily on his four seam and two seam fastballs and if they aren’t working the results aren’t going to be pretty. This year Lackey hasn’t been able to locate his fastballs and he has paid the price. Take a look at his fastball pitch plots for 2017 vs. 2016 below.
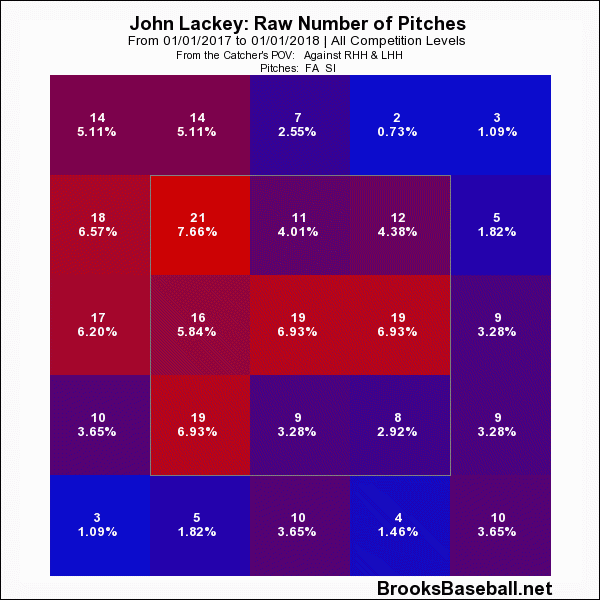
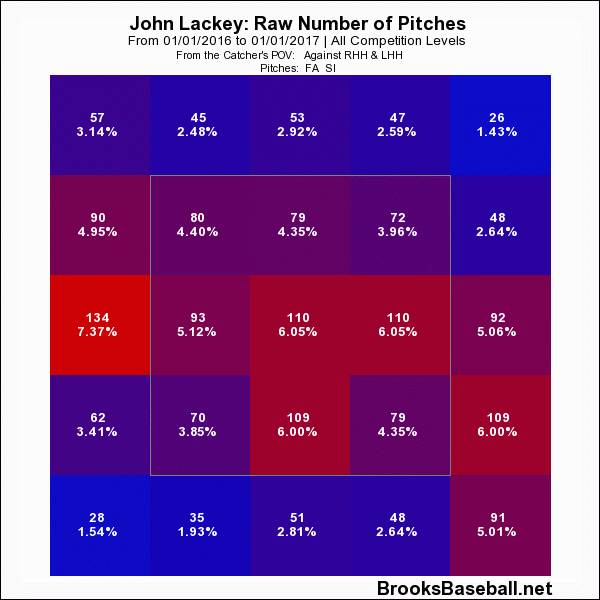
Lackey’s leaving way too many hittable fastballs in the zone in 2017. If he can correct this and become a quality number four starter like he was in 2016, that would be excellent because the last member of the Cubs rotation included in this analysis may not be a regular member of the rotation much longer.
Brett Anderson:
- April 2015: BF = 86 , ERA = 5.49, FIP = 3.95, K% = 12.8%, BB% = 4.7%
- April 2016: N/A – Injured
- April 2017: BF = 92, ERA = 3.54, FIP = 3.89, K% = 15.2%, BB% = 12.0%
Ironically, if you just looked at ERA you could argue that Brett Anderson was the Cubs’ most successful starter in April 2017. Unfortunately, ERA does not do a great job of measuring a pitcher’s true talent and on virtually every other metric Anderson has graded out poorly thus far in 2017. Anderson was brought in primarily to induce ground balls, something he excelled at in his last healthy season in 2015, when Anderson possessed a ground ball rate of over 66 percent. Thus far in 2017, Anderson’s ground ball rate is approximately 50 percent. In 2015 Anderson had a walk rate of 6.1 percent, and he doubled that figure in April of 2017 and currently sports a net strikeout rate (K%-BB%) of 2.9 percent, which is among the bottom five worst among starters in baseball in 2017. After Monday’s inning and a third debacle against the Phillies, Brett Anderson had an average exit velocity given up of 89.5 mph, this is the worst figure among the entire Cubs pitching staff, bullpen or starter. I don’t mean to keep piling on like this, but at a certain point the Cubs may have to pull the plug on the Brett Anderson experience and examine their other options, whether they be internal, or external.
Lead photo courtesy Steve Mitchell—USA Today Sports
Wow. this is fascinating. Good stuff.