Growing up in the Chicagoland area in the mid 1990’s, it was impossible to escape the shadow of the Chicago Bulls. Each summer seemingly brought a new championship to the city complete with a parade that usually culminated with someone like Steve Kerr making wise cracks at Grant Park. Since Space Jam holds a special place in my heart, I always loved the MJ tongue-out dunks, but now that I’m older I see that the true greatness of those Bulls teams was actually their “doberman” defense led by Michael Jordan and Scottie Pippen. People remember Jordan’s last shot in Utah vividly, but they forget that it was set up by a savvy MJ steal from Karl Malone in the waning moments when all the Jazz had to do was run out the clock.
I bring this up not as selfish trip down nostalgia lane (ok, maybe that’s a lie), but because there’s a chance that we might remember the 2016 Cubs in the same way; as a team that, despite possessing a great offense and solid pitching, had a defense that made their superb record possible. Or is this line of thinking not giving enough credit to the Cubs pitchers (specifically their starters) who have performed admirably throughout the season? As more and more Statcast data becomes available, it’s only a matter of time before defense-independent pitching statistics become outdated, and we learn that pitchers do have some degree of control over balls in play. So who deserves credit for the 2016 Chicago Cubs’ outstanding display of run prevention? Let’s dig into the data to find out.
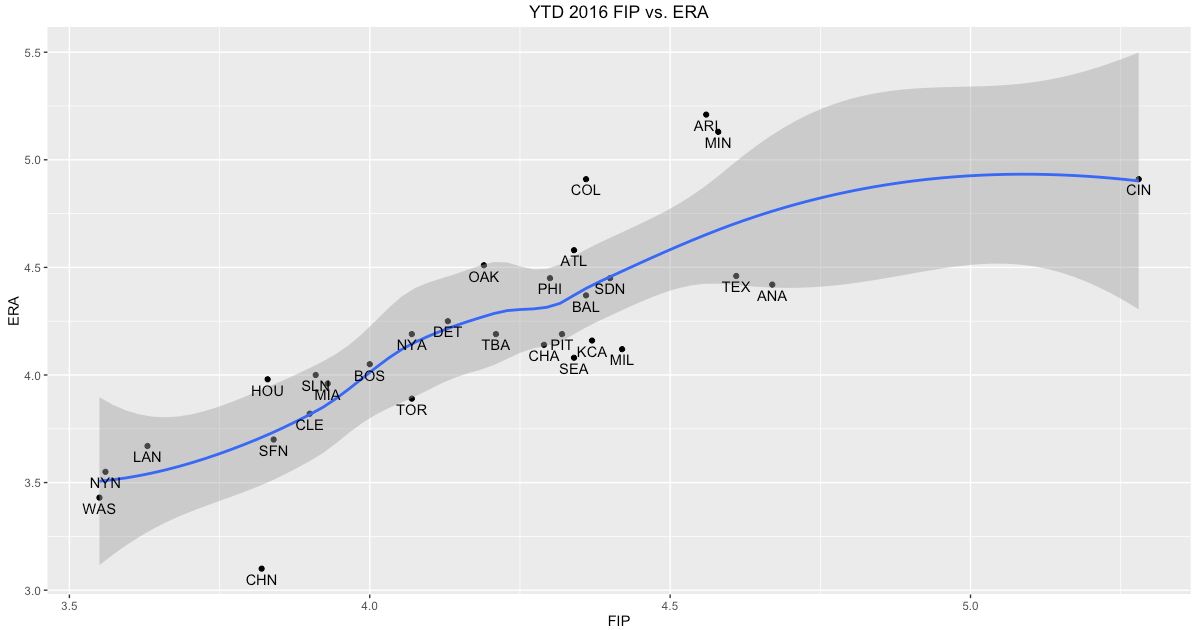
By most of the run prevention metrics we have, the 2016 Cubs defense is in a class by itself. To illustrate just how dominant the 2016 Cubs defense has been I’ve included some visuals below. For comparison purposes I’ve looked at data (if available) from the 1973 season onwards (the inception of the designated hitter). Let’s start with the 2016 Fielding Independent Pitching (FIP) vs. ERA plot. The 2016 Cubs currently have a FIP 0.72 percentage points higher than their ERA; this is the highest difference for any team since 1973.
To dig in further into the 2016 Cubs’ FIP vs. ERA difference, I reviewed the underlying statistic that serves as the foundation for FIP: BABIP. Below I’ve plotted a histogram which presents the BABIP-allowed for each major league team since 1973. Unsurprisingly, the 2016 Cubs also stick out within this metric.
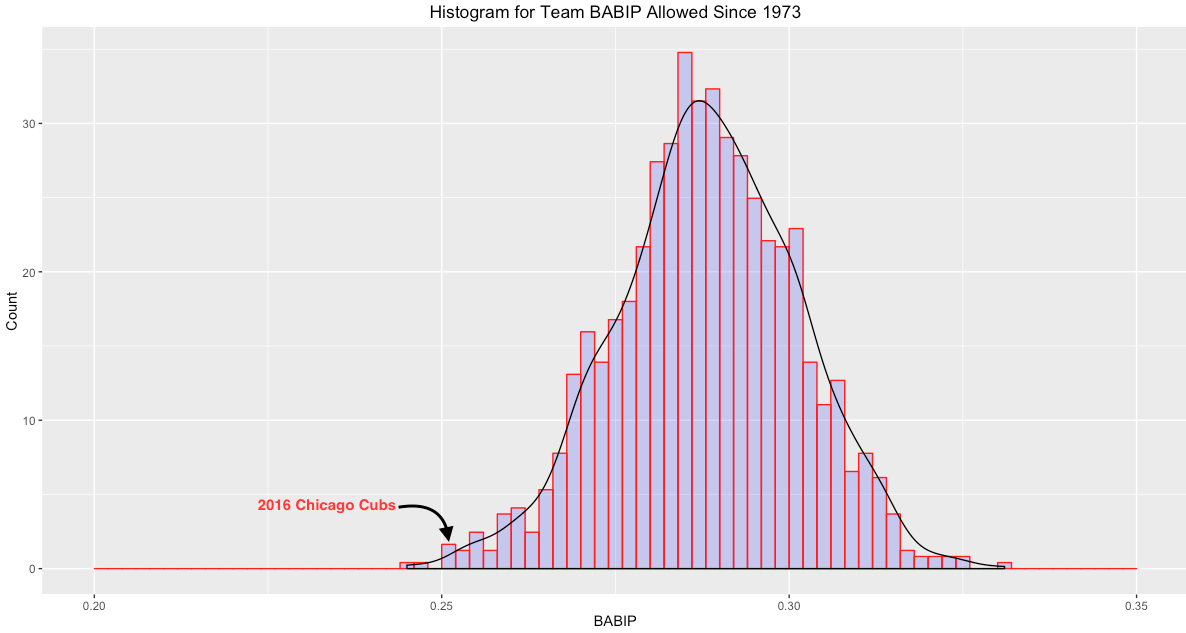
The 2016 Cubs currently have a BABIP-allowed of .252; the next lowest BABIP-allowed in 2016 is over 30 points lower. Only two teams since 1973 have posted lower figures than the 2016 Cubs, and none since 1981. It gets even more historically impressive when you compare the 2016 Cubs to the league average. Below I’ve included a table that adjusts a team’s mark to fit on a 100 point scale (BABIP+). For example, a score of 98 would mean that a team’s BABIP allowed was two percent less than that year’s league average, while a score of 107 would show that a team’s score was seven percent higher than league average. I’ve broken out the top five and bottom five on each side of the spectrum in the tables below:
Top 5 BABIP+
| Team | Year | League BABIP | Team BABIP | BABIP+ |
| CHN | 2016 | 0.297 | 0.252 | 85 |
| LAN | 1975 | 0.277 | 0.245 | 88 |
| CIN | 1999 | 0.298 | 0.262 | 88 |
| SEA | 2001 | 0.292 | 0.26 | 89 |
| DET | 1981 | 0.274 | 0.247 | 90 |
Bottom 5 BABIP+
| Team | Year | League BABIP | Team BABIP | BABIP+ |
| COL | 1999 | 0.298 | 0.325 | 109 |
| SEA | 1986 | 0.282 | 0.309 | 110 |
| CLE | 1981 | 0.274 | 0.303 | 111 |
| COL | 2012 | 0.293 | 0.325 | 111 |
| TBA | 2007 | 0.299 | 0.331 | 111 |
On each end of the scale, even the outliers struggle to get beyond 10 percent away from the league average for that year. The 2016 Cubs, meanwhile, have a BABIP allowed that is fifteen percent lower than the 2016 league average; no other team since 1973 can come close to matching this. And that’s not all: check out where they fall on Park Adjusted Defensive Efficiency (PADE) scores for all teams from the 1973 onward.
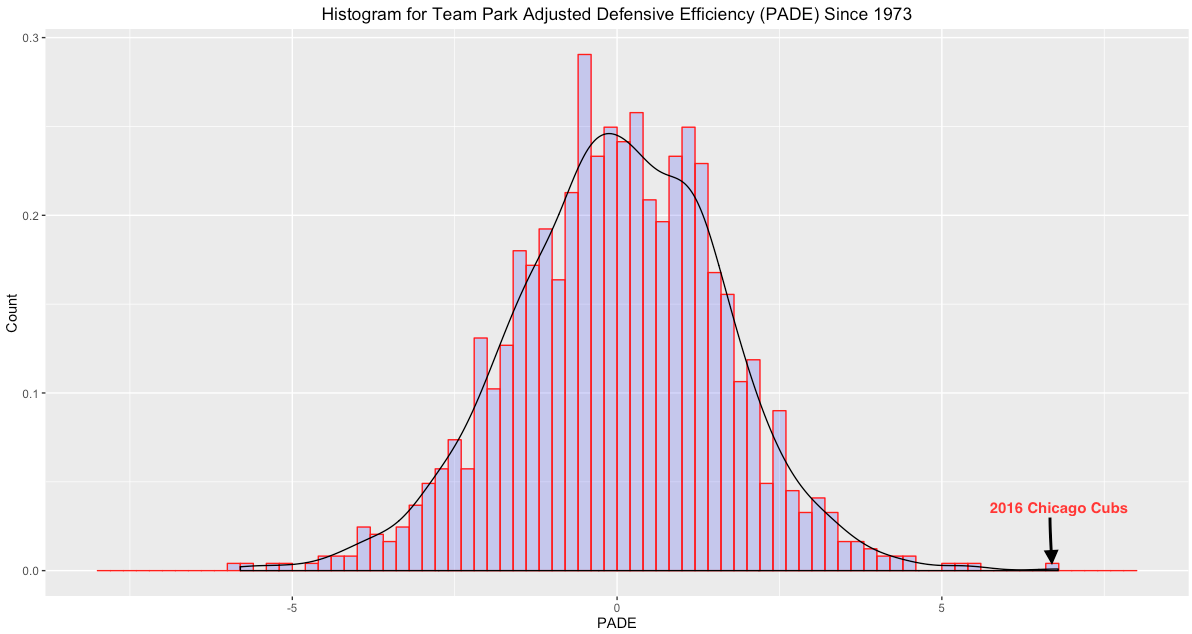
The 2016 Cubs currently have a PADE of 6.76; the next highest 2016 competitor (Los Angeles Dodgers) has a PADE of 2.06. Since 1973, only three major league teams had PADEs over five, the last being the 116-win Seattle Mariners in 2001. No other team since 1973 has ever had a PADE over six.
So it’s abundantly clear that the 2016 Cubs have an excellent defense. If we just wanted to look at the 2016 Cubs from a DIPS point of view, we could safely conclude that the outlandishly low BABIP allowed was due to defense and/or luck. While this isn’t necessarily incorrect, it feels like an incomplete answer to the a complicated question; don’t the Cubs pitchers deserve some portion of the credit for the absurd level of run prevention the team has achieved in 2016? Thankfully now that we have Statcast data we don’t have to accept this answer.
Using Statcast batted ball data such as exit velocity and launch angle I attempted to figure out what factors that a pitcher could control that would change their overall BABIP allowed. I limited my analysis to starting pitchers who pitched at least 100 innings in 2015 and/or 2016, and I plotted each pitcher’s average exit velocity against their corresponding season’s BABIP below.
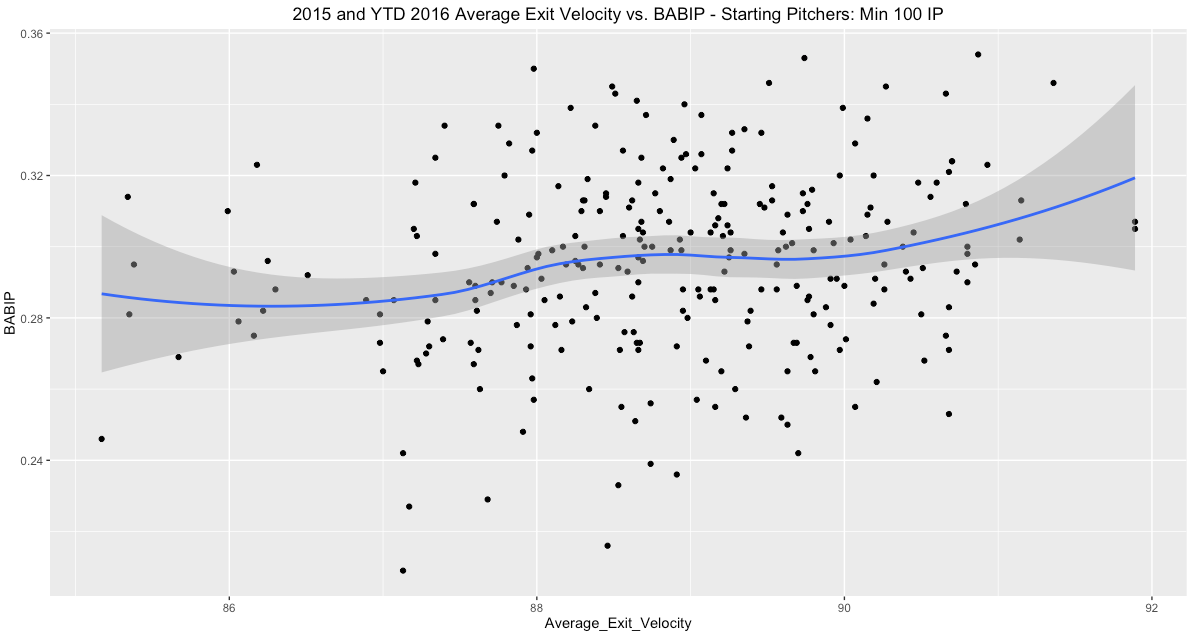
The result was a weak-to-moderate positive correlation (r=.201) between an individual’s average exit velocity allowed and BABIP. This makes sense since BABIP doesn’t include home runs (generally when pitcher’s hardest hits are given up), while average exit velocity does. So I took out the 2015 and 2016 home runs from the Statcast data for the pitchers that fit the above criteria and plotted their non-home run inclusive exit velocities against their BABIP for the respective year(s).
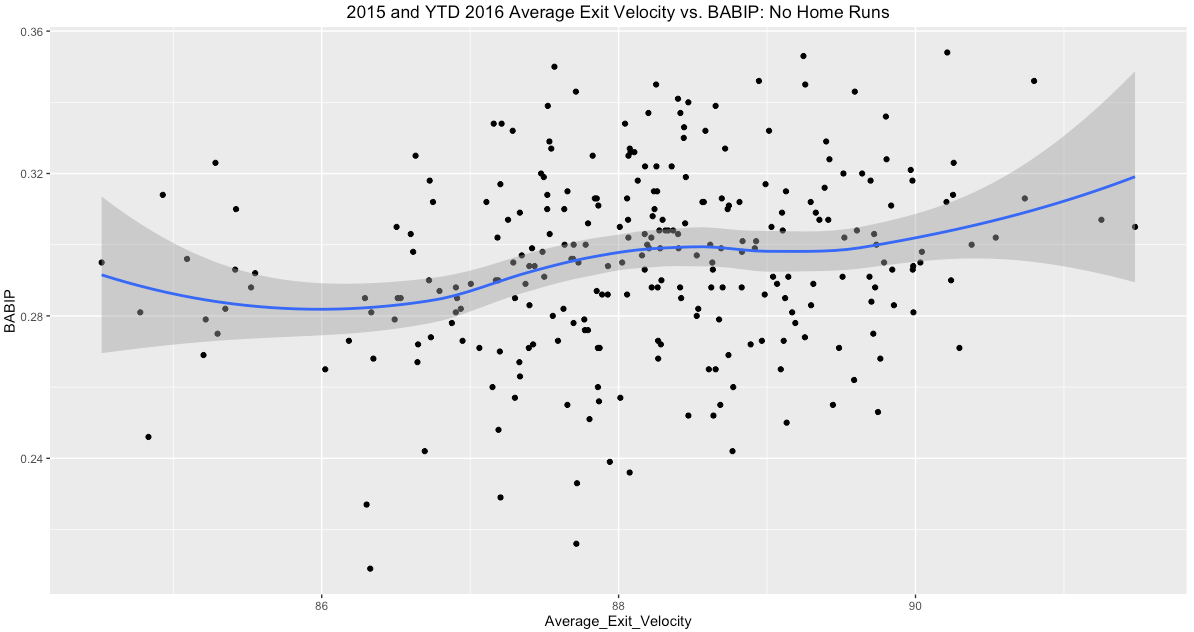
The results are about the same with similar weak to moderate positive correlation (r=0.220). So if exit velocity alone doesn’t really affect BABIP all that much, what can a pitcher do to limit the effectiveness of balls in play? Using a generalized additive model (GAM) I plotted below the probabilities that a batter would reach base (on an error, single, double, triple, home run, fan interference) given their exit velocity and launch angle on any given hit. A hard hit ball is more likely to be a hit than not, for example.

Unsurprisingly, the best way a pitcher can limit his BABIP allowed is to either induce soft contact and/or keep the hitters at bay through non-optimal launch angles. So how did the 2016 Cubs starters do in limiting their average exit velocity and depressing launch angles compared to 2015?
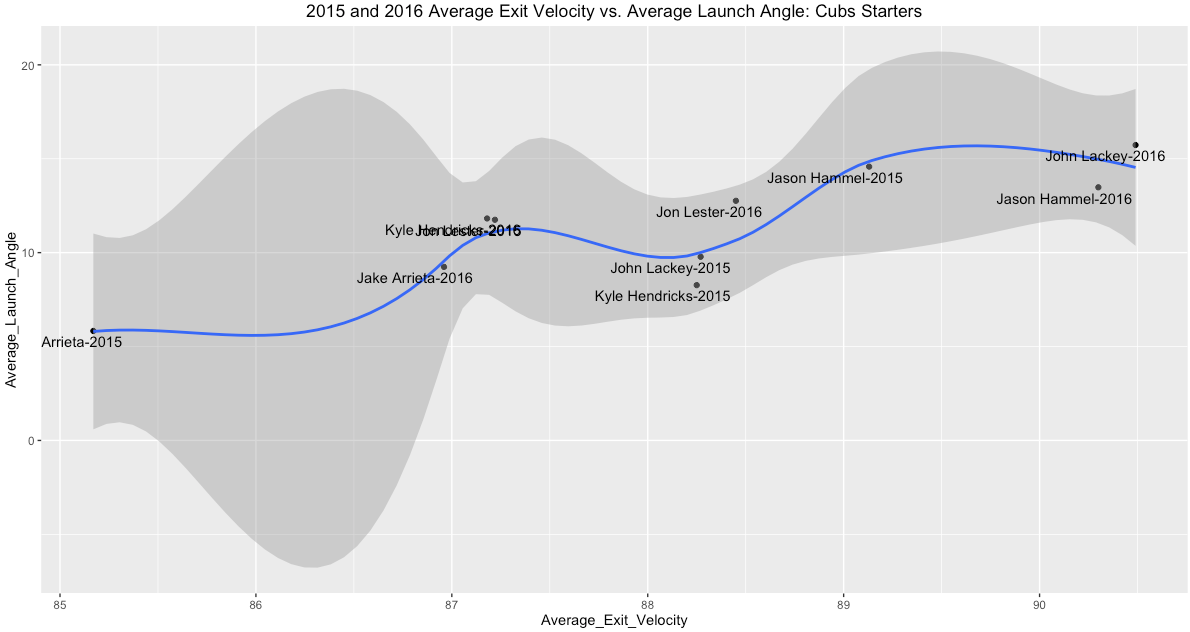
In a word? Well. Jake Arrieta remains difficult to square up when he can locate his pitches and his mechanics are right, while 2016 NL Cy Young contender Kyle Hendricks has dropped over one mph off his average exit velocity in 2016 compared to his performance last year. The other three Cub starters (including Jon Lester) have seen their average velocity increase in 2016 compared to last year. Now let’s compare this information to each Cub starters BABIP for 2015 vs. 2016 to see if we can see a pattern.
| Player | 2015 BABIP | 2016 BABIP | 2015 ERA | 2016 ERA |
| Jake Arrieta | 0.246 | 0.228 | 1.77 | 2.96 |
| Jason Hammel | 0.288 | 0.264 | 3.74 | 3.56 |
| John Lackey | 0.295 | 0.249 | 2.77 | 3.39 |
| Jon Lester | 0.303 | 0.257 | 3.34 | 2.36 |
| Kyle Hendricks | 0.296 | 0.242 | 3.36 | 2.06 |
Each starter’s BABIP has gone down in 2016 vs. 2015, but we know from the plot above that Lester, Lackey, and Hammel all had higher exit velocities and launch angles in 2016 than in the prior year. Intuitively, if pitchers are giving up harder hit balls on average at more optimal launch angles, shouldn’t more of those balls fall in for hits? This led me back to the Cubs defense to see if I could use the Statcast data available to prove out how the defense could be suppressing BABIP in 2016. To do so I created two separate data sets: one that included all balls in play information for the 2016 Cubs, and one that included all balls in play information for the 29 other teams. I isolated all times a runner reached base (i.e. single, double, triple, home run, fan interference, error) in the latter dataset and calculated the average launch angle (11.4 degrees) and standard deviation for launch angles (15.1 degrees) in these instances. Then using a GAM described above I calculated the probability of reaching base for the average reach base launch angle described above, along with launch angles one standard deviations both above and below the mean. Thus the plot below shows the probabilities of reaching base at these launch angles across the exit velocity spectrum for the combined balls in play for the twenty nine other major league teams. Basically: does the same ball, hit in front of the Cubs defense, perform differently?
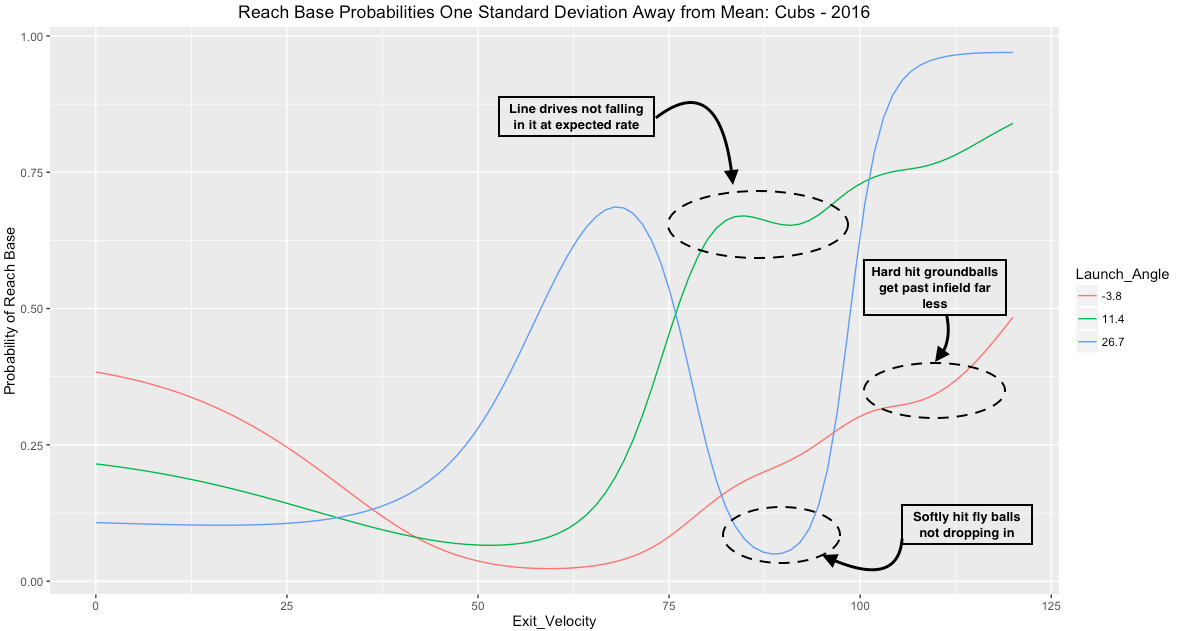
Suffice to say the 2016 Cubs had lower probabilities for reaching base at all three launch angles across pretty much the entire spectrum of exit velocity measurements. This isn’t a shock to anyone who has watched the Cubs play defense this year, but it’s somewhat comforting that Statcast data displays the same thing that our eyes and previous advanced metrics tell us.
Just by looking at this article you could conclude that the Cubs defense is responsible for a larger portion of the run prevention success than the Cubs pitchers, but smarter people than me have analyzed this same issue and come up with the exact opposite conclusion. And that’s ok, at the end of the day it doesn’t matter which aspect of the Cubs is the best or deserves the most credit, what matters is that they are an incredibly well constructed team whose sustained excellence has allowed for discussions like these to occur. With the playoffs quickly approaching, having an argument over whether or not your pitching or your defense is more responsible for your incredible run prevention is a good problem to have.
Lead photo courtesy Caylor Arnold—USA Today Sports.
WOW. thanks for taking the time to investigate this. It was interesting in an interview this week Lester and Hendricks suggested they pitched TO their defense and “made them look good.” It was taken by the reporter as a joke but I actually believed from Kyle’s other statements there is something to that. That is, he takes greater risks with no men on base (and with lower slugging hitters) and adds his change up more when it actually counts. (Haven’t checked to see if his velo changes).
In mentioning our beloved 90’s Bulls (may they live forever), it dawned on me that next year might truly be a team for all ages adding Schwarber (and Heyward’s historical cyclical rebound ) with another year of maturity of the kids – combined with familiarity of the KB/Russell/Baez/Rizzo infield defense combo. I know, I know….one year at a time. But except for wondering how we’ll replace Dex’s OBP in the leadoff position – I’m salivating for a similar path we saw with the Bulls – ultimately culminating in the Cubs version of the “72 win” season (117?).
Great stuff though. Thanks.
Thanks for the comment; that’s a good point regarding Hendricks I should take a look at Brooks to see if he does change his approach. I also day dream from time to time with the 90’s Bulls vs. this era Cubs comparisons, but you’re right one step at a time.