It’s no secret that the Cubs rotation has been different in 2017. Many would be quick to suggest that “different” is a nicer way of saying “bad”. While it’s certainly true that the results for the rotation have not been as good as in 2016, that does not in itself mean anything, nor does it explain what might have changed.
Many fans are probably tired of reading this, but it’s still early (yes, really), and it’s likely that at the end of the season, the poor early season numbers won’t be anywhere as extreme as they look now, compared to 2016. In fact, many readers will already feel better about the rotation than they did a week or two ago, thanks to some much more impressive starts than we saw over the first month of the season. With that in mind, the aim of this piece will be to not ask specifically what is wrong, but simply use one particular tool to think about what is different.
The new pitch tunnels data over at the main Baseball Prospectus site offers many possibilities. For instance, it’s now possible to see which pairs of pitches each pitcher uses most frequently, and how each pitch within those pairs compares to each other, from release point to arrival at the plate. This can therefore be used to determine which sequences each of the four mainstays has used more or less frequently in 2017.
In order to do this, the pitch pairs data for the Cubs in 2016 and 2017 was downloaded, and then the percentage of each individual pair out of the total number of pairs was calculated. The ten largest increases and decreases can be seen below.
Largest Sequence Usage Changes, 2016-17
| Pitcher | Sequence | 2016 | 2017 | Change |
|---|---|---|---|---|
| Jon Lester | FC|FC | 6.39% | 11.54% | 5.16% |
| Kyle Hendricks | CH|SI | 6.38% | 9.83% | 3.46% |
| John Lackey | SL|SL | 10.40% | 13.35% | 2.95% |
| Kyle Hendricks | FA|FA | 7.47% | 10.20% | 2.73% |
| Jake Arrieta | SL|SL | 3.41% | 5.98% | 2.58% |
| Jake Arrieta | SI|CH | 2.93% | 5.30% | 2.37% |
| John Lackey | SL|FA | 6.65% | 9.01% | 2.36% |
| John Lackey | FA|SL | 9.44% | 11.65% | 2.20% |
| Jake Arrieta | CU|SI | 6.21% | 8.38% | 2.17% |
| John Lackey | FA|CH | 1.83% | 3.88% | 2.05% |
| Jake Arrieta | SI|CU | 9.10% | 7.01% | -2.09% |
| John Lackey | CU|FA | 3.76% | 1.40% | -2.36% |
| Jon Lester | CU|FA | 5.32% | 2.89% | -2.44% |
| John Lackey | FA|SI | 6.21% | 3.57% | -2.64% |
| Jake Arrieta | SL|SI | 10.05% | 7.35% | -2.70% |
| Kyle Hendricks | FA|SI | 8.47% | 5.57% | -2.91% |
| Jon Lester | FA|CU | 6.52% | 3.17% | -3.34% |
| Kyle Hendricks | CH|CH | 11.90% | 8.53% | -3.36% |
| Jon Lester | FA|FA | 22.87% | 18.33% | -4.54% |
| Jake Arrieta | SI|SI | 36.44% | 25.98% | -10.46% |
Jake Arrieta stands out with the double-digit drop in consecutive sinker usage. It’s long been his go-to pitch, especially since he became a truly elite pitcher in Chicago, but this season marks the first decline in its usage since he became a key component of the rotation.
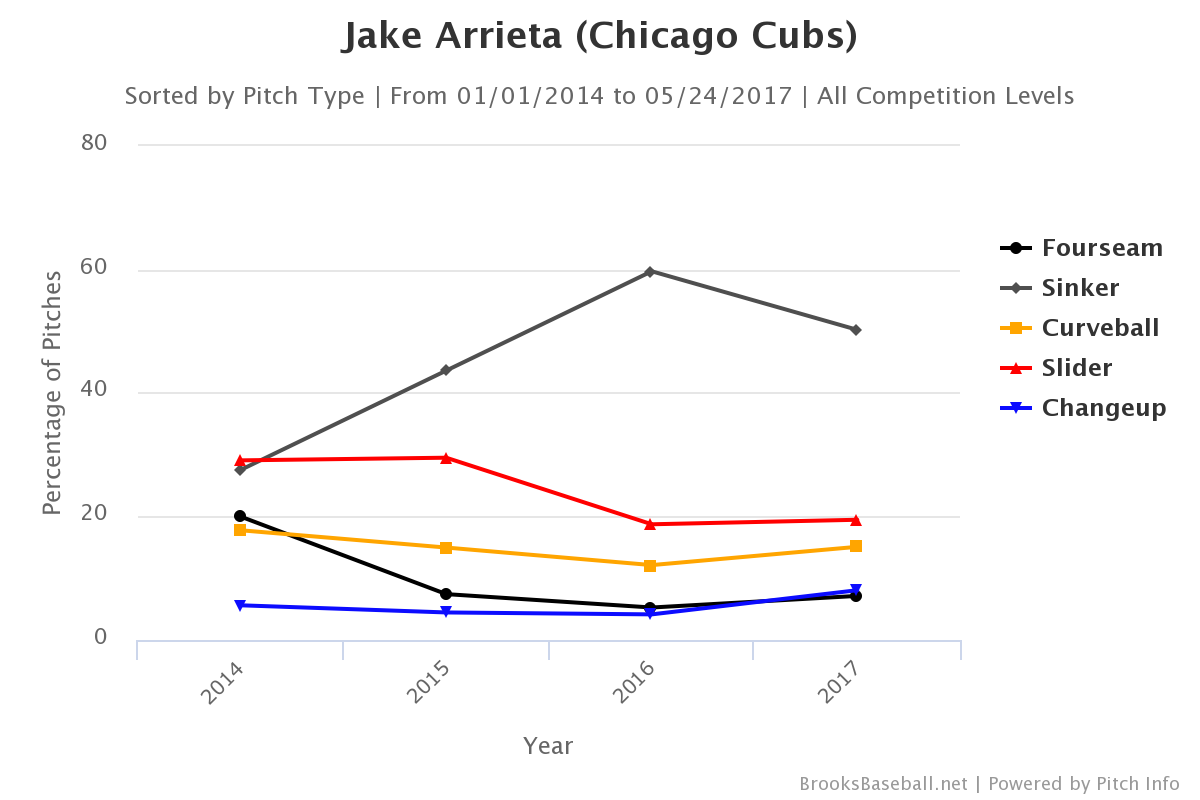
That’s not the only driver in the drop in consecutive sinkers, however. Arrieta has also started to follow his sinker up with his change more often, as can be seen towards the top end of the table. That 5.3% represents 31 occasions in which the 31-year-old has used that combo, a sequence he went to just 68 times in total in 2016. There seems to be an overall effort to increase the level of unpredictability after a sinker, with the curveball usage also dropping and the four-seam ticking up slightly. Whereas Arrieta followed up a sinker with another sinker in almost 60 percent of last year’s pairs, it’s essentially a 50-50 chance that he’ll do so this year. Arrieta got three swinging strikes just from the change following a sinker in his last start, arguably his best of the season.
At the opposite end of the spectrum is Jon Lester’s increase in consecutive cutter usage, which mirrors his decline in consecutive four-seam usage. Lester’s four-seam fastball is still his primary pitch, but the difference in frequency between that and his cutter has dropped dramatically. In fact, while the veteran lefty has always employed those pitches in that order of preference, the gap between them has fluctuated significantly from year to year.
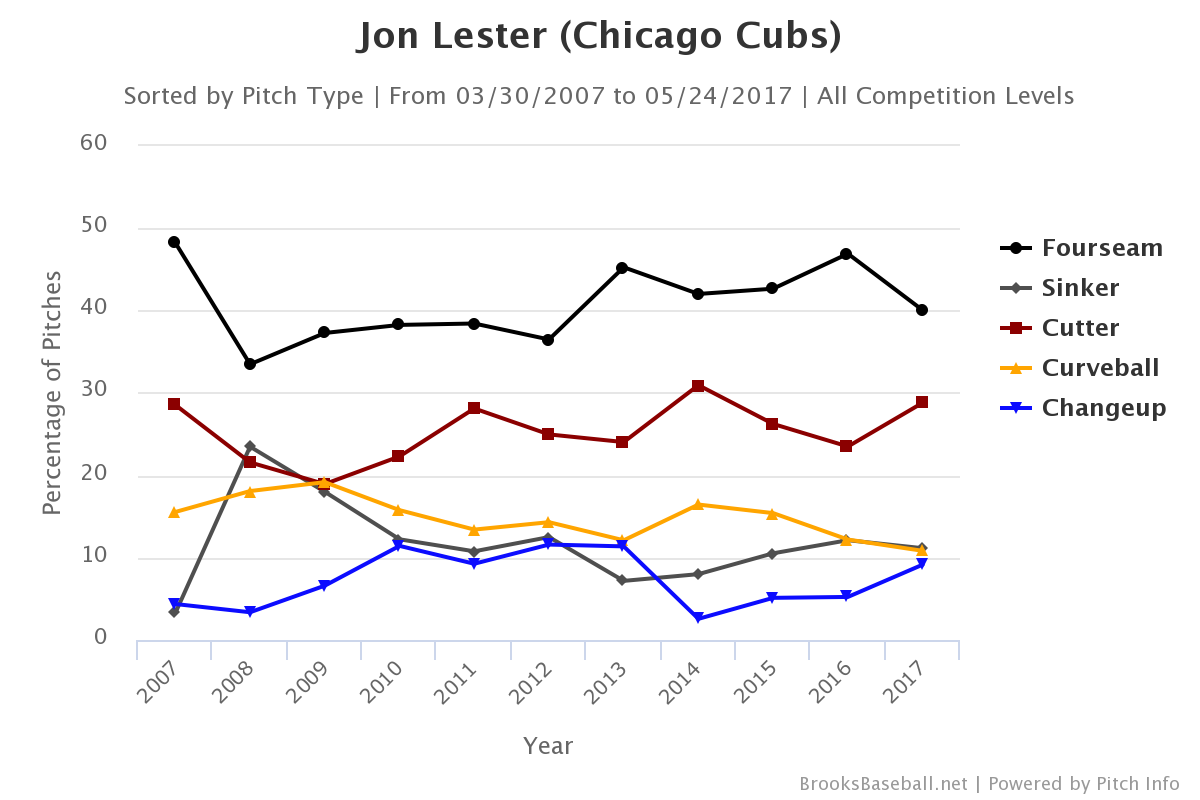
In both the Cardinals and Reds games this month, Lester actually used his cutter more often than his four-seam, something he had not done since July 2015. So far in 2017, Lester’s followed his cutter up with another cutter 40 percent of the time, as opposed to 29 percent in 2016, when he actually used his four-seam most often after the cutter, at 45 percent. That’s now dropped to the cutter rate of 2016, 29%. Lester’s remarkably consistent release point isn’t quite as exceptional as it was in 2016, yet it’s still one of the best in the league, and that, combined with the similarities in speed between the two fastballs, makes it very difficult to tell the two pitches apart. Hitters who got used to seeing a fastball almost half the time after a cutter are now having to adjust to a very different mix. This is the kind of thing that a pitcher like Lester will probably continuously tinker with in order to avoid predictability.
The changes in sequencing for Kyle Hendricks revolve primarily around his changeup. Whereas he followed a change with another change in over half of those sequences last year, this year that’s dropped to 37 percent, with almost all of the difference represented by the sinker, coming in as the second largest increase in our table. What’s particularly interesting about Hendricks with the sinker this year is that his changeup-sinker sequence (and the inverse) has a lower release-to-tunnel ratio than his consecutive changeup sequence, meaning there has been a smaller difference between those two pitches on average than when he throws the same pitch twice in a row. That might be misleading with Hendricks, given that he has two changeups, but it’s also indicative of why pitch tunnels are so important to his success.
The problem for Hendricks so far this year might be that they’re too similar. The amount of vertical movement on the pitches is almost identical, and while there has historically been a little more separation horizontally, they’ve gradually been moving closer together:
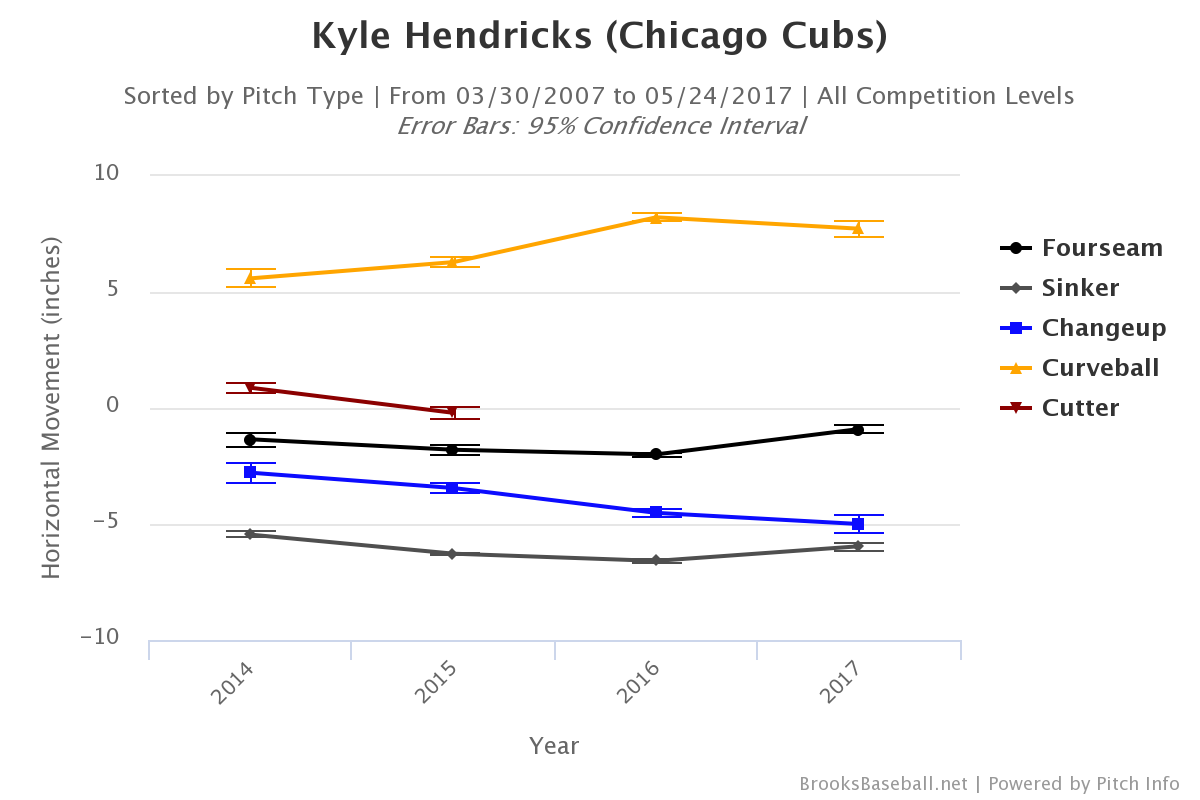
Hitters are swinging at Hendricks changeups less, and whiffing less. For a pitcher who relies so much on his pitches looking the same but not actually being the same, this combination may not work out for him unless he can figure out a way to increase that separation. If not, he may be better off going back to sequencing his changeup the way he was in 2016.
John Lackey’s changes are probably the least dramatic because he throws so many different pitches, and his success has never been about a tight release point or a narrow pitch tunnel, but about great variety and movement. His increase in slider-slider sequences is intriguing because his slider (or cutter, if you prefer the automatic designation that it has been given by Pitchf/x and now Trackman) has not been anywhere near as effective for him in 2017. Lackey’s using it more than ever – nearly 30 percent of the time – but here’s what has happened to the swings and misses on the pitch:
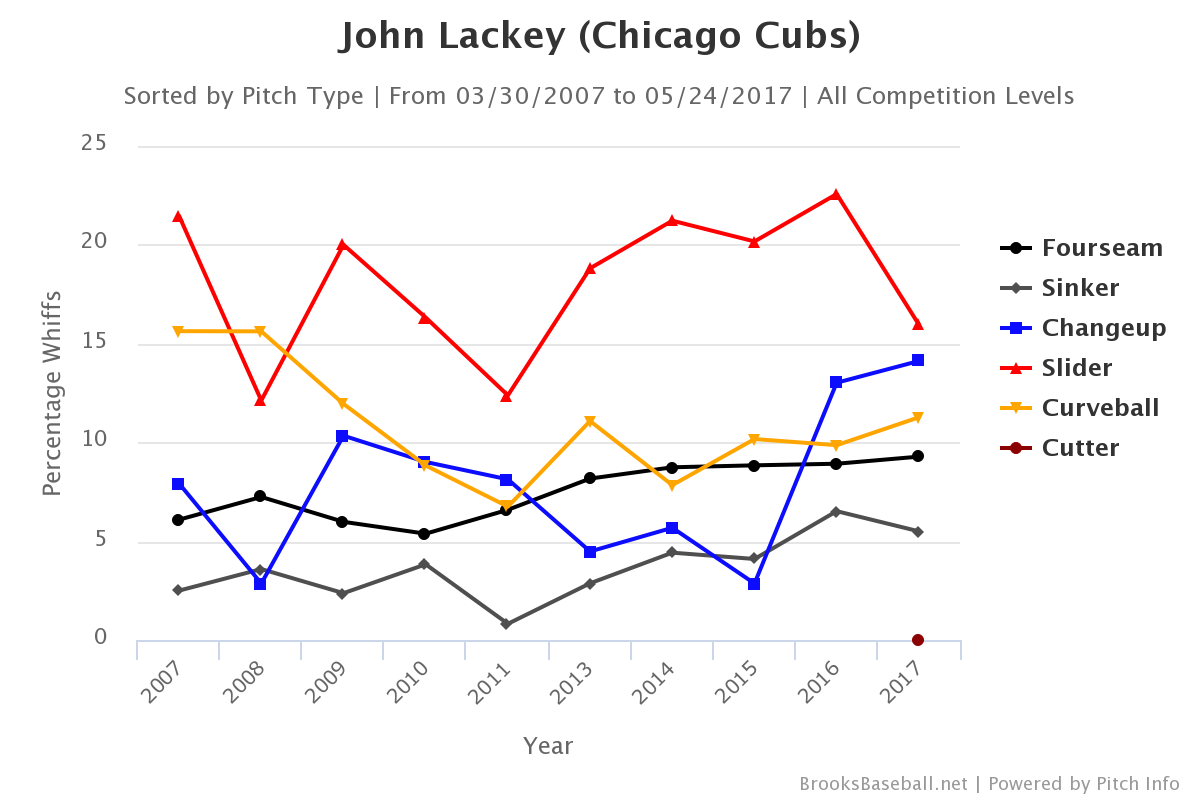
The pitch was extremely good last year, but now the whiff percentage is dropping dangerously close to the levels of Lackey’s pre-Tommy John season. It is, of course, still Lackey’s best pitch for strikeouts, and his other pitches haven’t been producing good results either. Perhaps it’s not surprising, then, that he’s not only using it more in consecutive slider sequences, but also in conjunction with his four-seam. If there is a problem, it seems to be that he isn’t locating it as far down as he normally does, which leads to outcomes like this:
Hitters has a .049 ISO against the slider last year; in 2017 it’s .183. The rise of this particular sequence might also be symptomatic of another problem: hitters are finding it easier to foul off the slider in those two-strike counts. According to the Statcast data, Lackey’s seen the slider get fouled off 21 times in such counts already this year, nearly half of the 45 times it happened across the whole 2016 season. Lackey didn’t need to go back to the slider very often last year when he was able to use it to punch hitters out; now he’s having to try it again as they get a piece of it in those two-strike counts.
All of these sequencing differences are just small components of each pitcher’s fortunes. The batter-pitcher matchup is often about unpredictability and small adjustments; some of these trends will have reversed themselves by the end of the season, while others will become more exaggerated. The sequencing data is a fascinating way we have to think about how pitchers change the way they attack hitters. I’m looking forward to finding out how the Cubs rotation continues to change.
Lead photo courtesy Dennis Wierzbicki—USA Today Sports