When this era of success at Wrigley Field comes to an end, and sportswriters are writing their farewell pieces and reminiscing about the memorable moments, there’s a good chance that player development and the pipeline of young talent that Theo Epstein, Jed Hoyer, Jason McLeod have built will be central to the overall storyline. And there’s no doubt that after years of over-hyped disappointments (remember the Corey Patterson, Felix Pie, and Brett Jackson eras? That’s just center fielders!), that watching multiple young players succeed in a Cub uniform at the major league level is nothing short of revolutionary. But player development doesn’t end in the minor leagues. The best franchises in baseball take it a step further, and seemingly out of nowhere are able to manufacture quality big league players on an annual basis. Case in point: Dexter Fowler. Below I’ve listed his career slash line prior to the 2015 season, followed by his 2015 first half performance, and then his performance since the 2015 All Star Break:
- Career slash line prior to 2015: .271/.368/.419
- 1st Half 2015 slash line: .232/.308/.369
- 2nd Half 2015 – Present slash line: .279/.393/.463
It’s been over a year since Fowler took off after the 2015 All Star Break and began performing at an All Star level. So, let’s ask ourselves:
- What was different between Fowler’s first and second half of 2015?
- How has Fowler’s second half 2015 success carried over this year?
- What role did player development play in this transformation?
Digging into Fowler’s career prior to 2015 shows some pretty intriguing slash lines (in particular in 2012 when he hit .300/.389/.474); unfortunately he was also a member of the Rockies from 2008-2013 so advanced stats took his numbers with a Coors Field-size grain of salt. His TAv (minimum 200 PA) only crept into the top ten once among center fielders as a member of the Rockies (2011, 8th). Just after the 2013 season Fowler was dealt from the Rockies to the Astros and put up a 2014 slash line (.277/.375/.399) that looked similar to his 2013 figures (.263/.369/.407), but after adjusting for park and league quality with TAv the improvement was actually quite significant (2014, .292 vs. 2013, .265). Seeing this improvement, and knowing that his perceived defensive liabilities could be mitigated by Wrigley Field, the Cubs front office jumped at the opportunity to plug in Fowler at the top of the lineup in exchange for Luis Valbuena and Dan Straily. The trade looks like a decisive victory for the Cubs now, as Fowler has 6.3 bWAR since joining the Cubs, vs. Valbuena’s 4.5 bWAR during that same time period (Straily pitched just 16 2/3 innings in 2015 and was traded prior to the 2016 season). However, in the first half of 2015, when Fowler was struggling to keep his OBP above .300 this trade was looking like anything but a win for the Cubs. Yet after the 2015 All Star Break, Fowler, for the lack of a better phrase, starting hitting the crap out of the ball.
Below I’ve plotted Dexter Fowler’s exit velocity and launch angle averages over rolling 50-batted-ball samples from the start of 2015 to YTD 2016. I’ve circled three different points in time: the red circle denotes early May 2015 when Fowler’s moving average exit velocity bottomed out at 79.4 mph, the black circle signifies the beginning of the 2015 second half, while the green circle illustrates the beginning of the 2016 season.
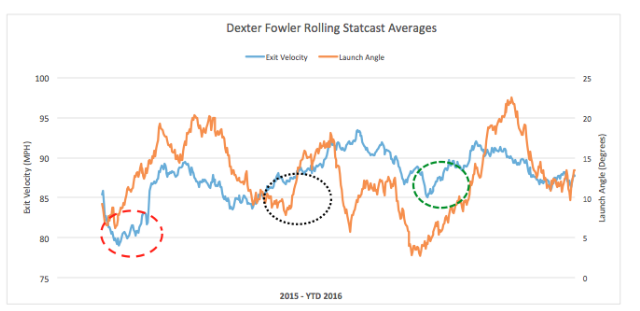
The Statcast data shows that Fowler’s slash line improvement since the start of the 2015 second half is no accident, he’s been consistently crushing the ball, oftentimes at launch angles that are associated with line drives. So what changed from the first half of 2015? I took a look at Brooks Baseball to try and find out. Below I’ve listed the first half 2015 pitch breakout results compared to the corresponding second half 2015 pitch breakout:
1st Half 2015 Pitch Breakout and Results
| Pitch Type | Pitch Count | Pitch % | BAA | SLG | ISO | BABIP |
| Fourseam | 535 | 35.9% | 0.216 | 0.352 | 0.136 | 0.235 |
| Sinker | 338 | 22.7% | 0.351 | 0.520 | 0.169 | 0.400 |
| Change | 216 | 14.5% | 0.174 | 0.196 | 0.022 | 0.242 |
| Slider | 139 | 9.3% | 0.100 | 0.200 | 0.100 | 0.143 |
2nd Half 2015 Pitch Breakout and Results
| Pitch Type | Pitch Count | Pitch % | BAA | SLG | ISO | BABIP |
| Fourseam | 492 | 38.0% | 0.303 | 0.532 | 0.229 | 0.354 |
| Sinker | 275 | 21.2% | 0.235 | 0.392 | 0.157 | 0.262 |
| Change | 174 | 13.4% | 0.333 | 0.462 | 0.128 | 0.353 |
| Slider | 128 | 9.9% | 0.261 | 0.565 | 0.304 | 0.571 |
In both halves these four pitches comprise approximately 82 percent of total pitches seen by Dexter Fowler; but that’s where the similarities end. Building off of analysis done earlier by BP Wrigleyville and Bleacher Nation, Fowler’s success against off-speed/breaking pitches led to him pulling the ball with more authority in the second half of 2015. But the real story behind Fowler’s success during this time period was his increased performance against four seam fastballs. I’ve plotted the location of four seam fastball and sinkers thrown to Dexter Fowler below to see what types of changes might have occurred between the first half and the second half of the 2015 season. Before we delve into each of these, keep in mind that Dexter Fowler takes the majority of his at-bats as a left hander (77 percent of 2015 at bats were as a left handed batter), so a density of 0.2 on the right side is not equivalent to the same number of pitches as density of 0.2 on the left side.
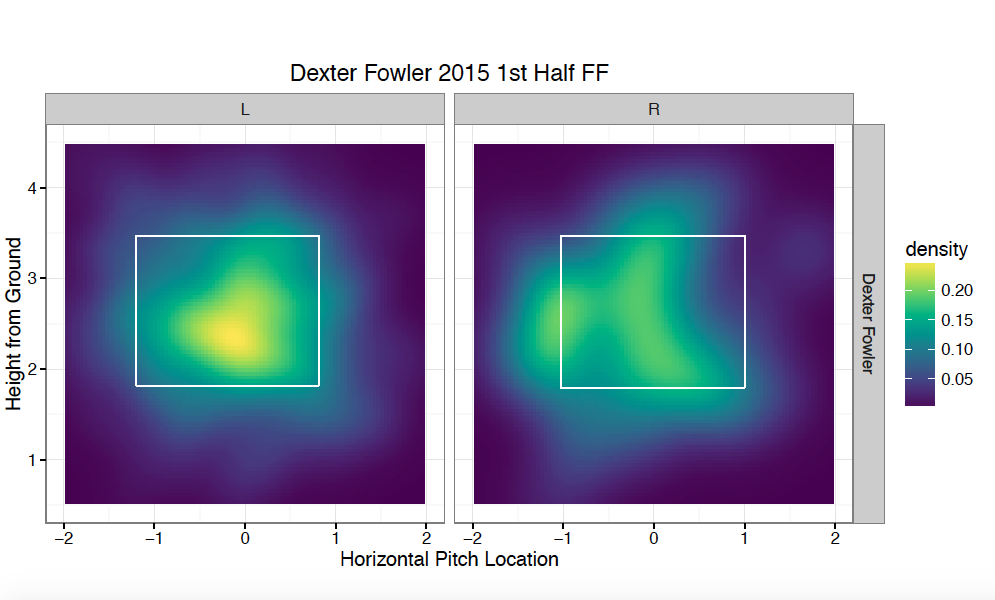
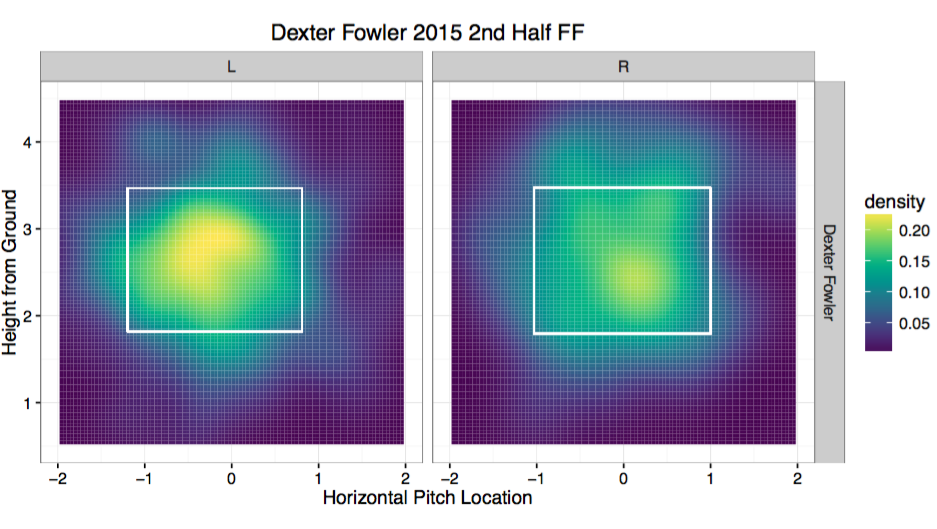

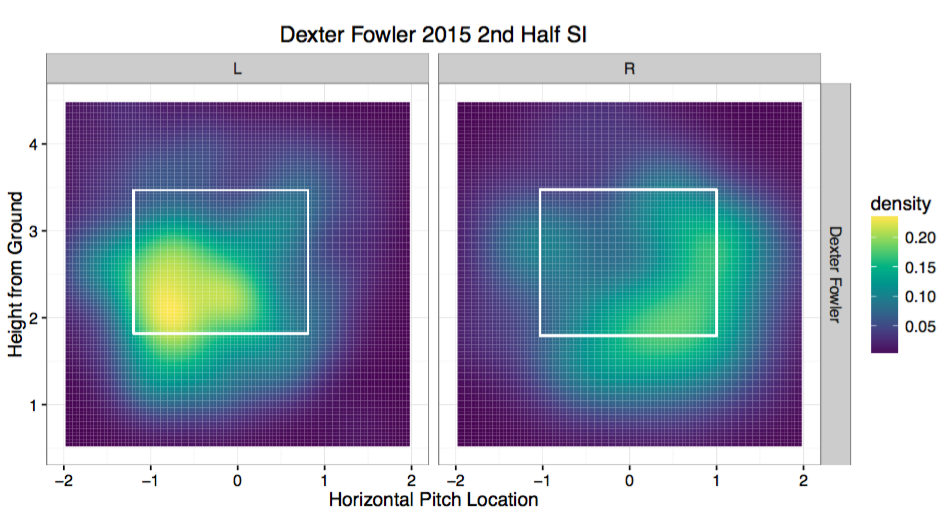
Fowler was able to successfully adjust in the 2015 second half as pitchers stopped trying to jam him in on his hands and instead, attempted to blow him away with four seamers high in the zone. Fowler’s success against four seam fastballs in the second half of 2015 helped him overcome a dip in his performance against sinkers, and set the stage his increased performance against breaking pitches. His fastball hitting prowess continued into 2016. Below I’ve listed the year to date 2016 pitch breakout results from Brooks Baseball.
2016 Pitch Breakout and Results
| Pitch Type | Pitch Count | Pitch % | BAA | SLG | ISO | BABIP |
| Fourseam | 640 | 37.3% | 0.310 | 0.519 | 0.209 | 0.337 |
| Sinker | 308 | 18.5% | 0.500 | 0.871 | 0.371 | 0.500 |
| Change | 217 | 13.0% | 0.146 | 0.229 | 0.083 | 0.200 |
| Slider | 209 | 12.5% | 0.229 | 0.371 | 0.143 | 0.500 |
By making himself an excellent fastball hitter Fowler is effectively forcing pitchers to go to their offspeed/breaking stuff more often. In 2015 35 percent of pitches thrown to Dexter Fowler were offspeed/breaking, so far in 2016 that figure has increased to 39 percent. All pitchers to some degree depend on their fastballs to right the ship when their breaking repertoire isn’t crisp; if Fowler is continually forcing them out of their comfort zone he’s already won half the battle. And it’s not like pitchers haven’t forced Fowler to make adjustments. See below for the location of four seam fastball and sinkers thrown to Dexter Fowler so far in the 2016 season.
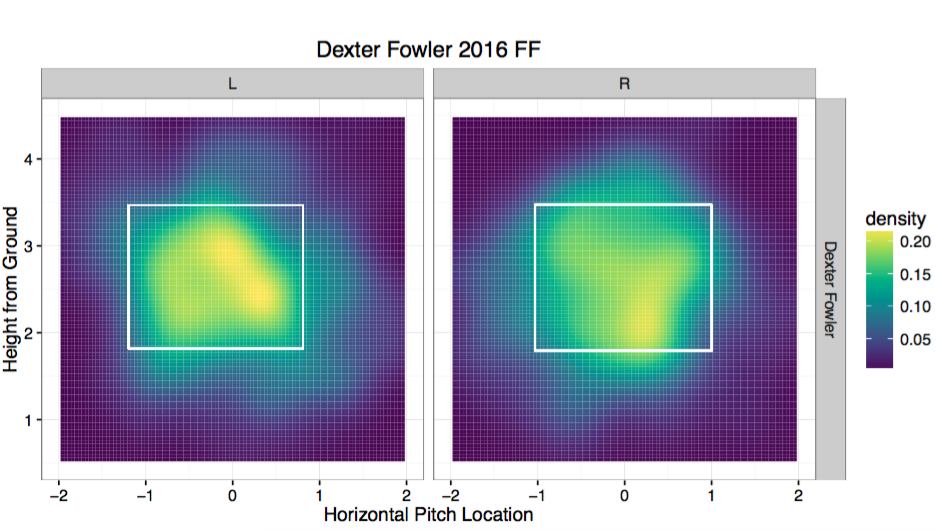
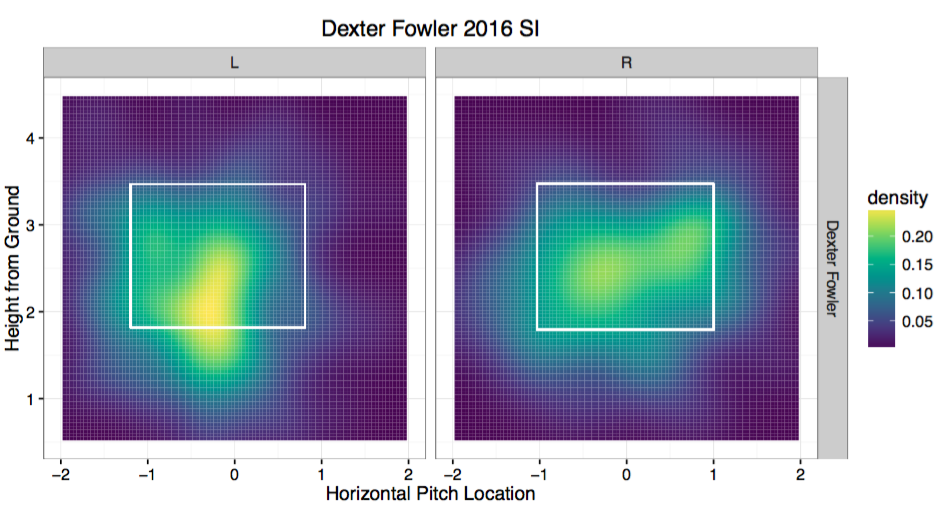
In 2016 pitchers went back to trying to jam Fowler inside with four seam fastballs and went even lower in the strike zone with their sinkers, but it hasn’t worked. The Statcast data listed in the tables below also shows the improvements made on fastballs in a more succinct way.
Four Seam Fastball Statcast Data
| Period | Balls In Play | Avg. EV | Avg. LA |
| 1st Half 2015 | 99 | 85.3 mph | 12.4° |
| 2nd Half 2015 | 76 | 91.9 mph | 13.2° |
| YTD 2016 | 87 | 88.1 mph | 18.8° |
Sinker Statcast Data
| Period | Balls In Play | Avg. EV | Avg. LA |
| 1st Half 2015 | 55 | 86.0 mph | 14.3° |
| 2nd Half 2015 | 47 | 91.0 mph | 5.5° |
| YTD 2016 | 54 | 91.6 mph | 8.6° |
But maybe it’s about more than Dexter Fowler. Barring a total collapse in 2016, Fowler will have his three highest TAv seasons in 2014-2016. It’s no coincidence that in each of those seasons his hitting coach was John Mallee. For people outside the clubhouse the impact of the coaching staff, specifically the hitting and pitching coaches, can be a difficult thing to evaluate or quantify. Ultimately it’s difficult to ascertain what credit is due to the coaches and what is due to the players. Leo Mazzone was a genius in Atlanta when he had Glavine, Maddux and Smoltz, and then he wasn’t in Baltimore; Rudy Jaramillo was a hitting wizard in Texas when he had A-Rod in his prime, and then came to the Cubs and failed to replicate any of his previous success; Rick Peterson was the forgotten hero of Moneyball and played a pivotal role in developing Hudson, Mulder, and Zito. Then he followed Art Howe to the Mets and wasn’t heard from again. It’s much easier to assume that all else being equal talent will win out regardless. But it’s clear through interviews and their actions that major league players and front office members don’t believe this, in particular Cubs personnel are quick to praise both pitching coach Chris Bosio and the aforementioned hitting coach Mallee.
Despite being in the current era of big data where each major league team employs vast armies of statisticians and computer scientists to comb through each and every aspect of the game, the ability of an on-field coach to synthesize and communicate a game plan, know an individual player’s strengths and weaknesses, and then maximize the player’s talent remains essential to player development at the major league level. And it appears that with the success of Dexter Fowler, the continued emergence of Addison Russell, and the complete turnaround that Jake Arrieta has experienced after being deemed expendable for Scott Feldman and Steve Clevenger, that the Cubs have two such coaches in Bosio and Mallee who are able to not only make established stars like Kris Bryant, Jon Lester, and Anthony Rizzo look good, but also help lesser known players take the next step to being a solid above average major league contributors. To be fair, after having seen the Adam Warren experience first hand, it’s clear that Bosio and Mallee aren’t going to connect with each major leaguer they see. But their success rate has been very promising and an underrated component of the Cubs future success may be in how long they can keep Bosio and Mallee on their payroll and not in another team’s dugout as manager.
Regardless of what portion of credit you want to assign the Cubs coaching staff for Dexter Fowler’s improvement as a fastball hitter, the reality is that for a very reasonable price of $8 million during the 2016 season the Cubs have employed one of the best centerfielders in the league at the top of their lineup. Fowler’s totally unexpected signing at the onset of 2016 Spring Training has turned into perhaps the biggest bargain of the year. Who knows, with the Statcast data we have available now maybe we would have been able to properly evaluate Dexter Fowler earlier in his career instead of just dismissing his numbers because of the Coors Field effect, and this level of play from him wouldn’t seem as surprising. Perhaps I’m overthinking all of this, after all Fowler was naturally a righty and taught himself to bat left handed only after he turned pro. Maybe the lesson is simple: Don’t bet against Dexter Fowler.
Lead photo courtesy Ron Chenoy—USA Today Sports.